

Alberta once again leads the nation in taking in more new residents than it loses to other provinces and territories.1 But, if homeowners seeking greater affordability leave Toronto, Vancouver, or Montreal for Calgary, are they in for an unfortunate surprise? Using Statistics Canada 2016 and 2021 census data, this report briefly examines the largest municipality in each province west of Atlantic Canada, to compare property taxes, in absolute and relative terms, to measure the weight of its burden on homeowners. Specifically, we examine changes over time in:
This analysis provides insight into how property taxation has evolved and its impact on homeowners in key urban centers across Central and Western Canada.
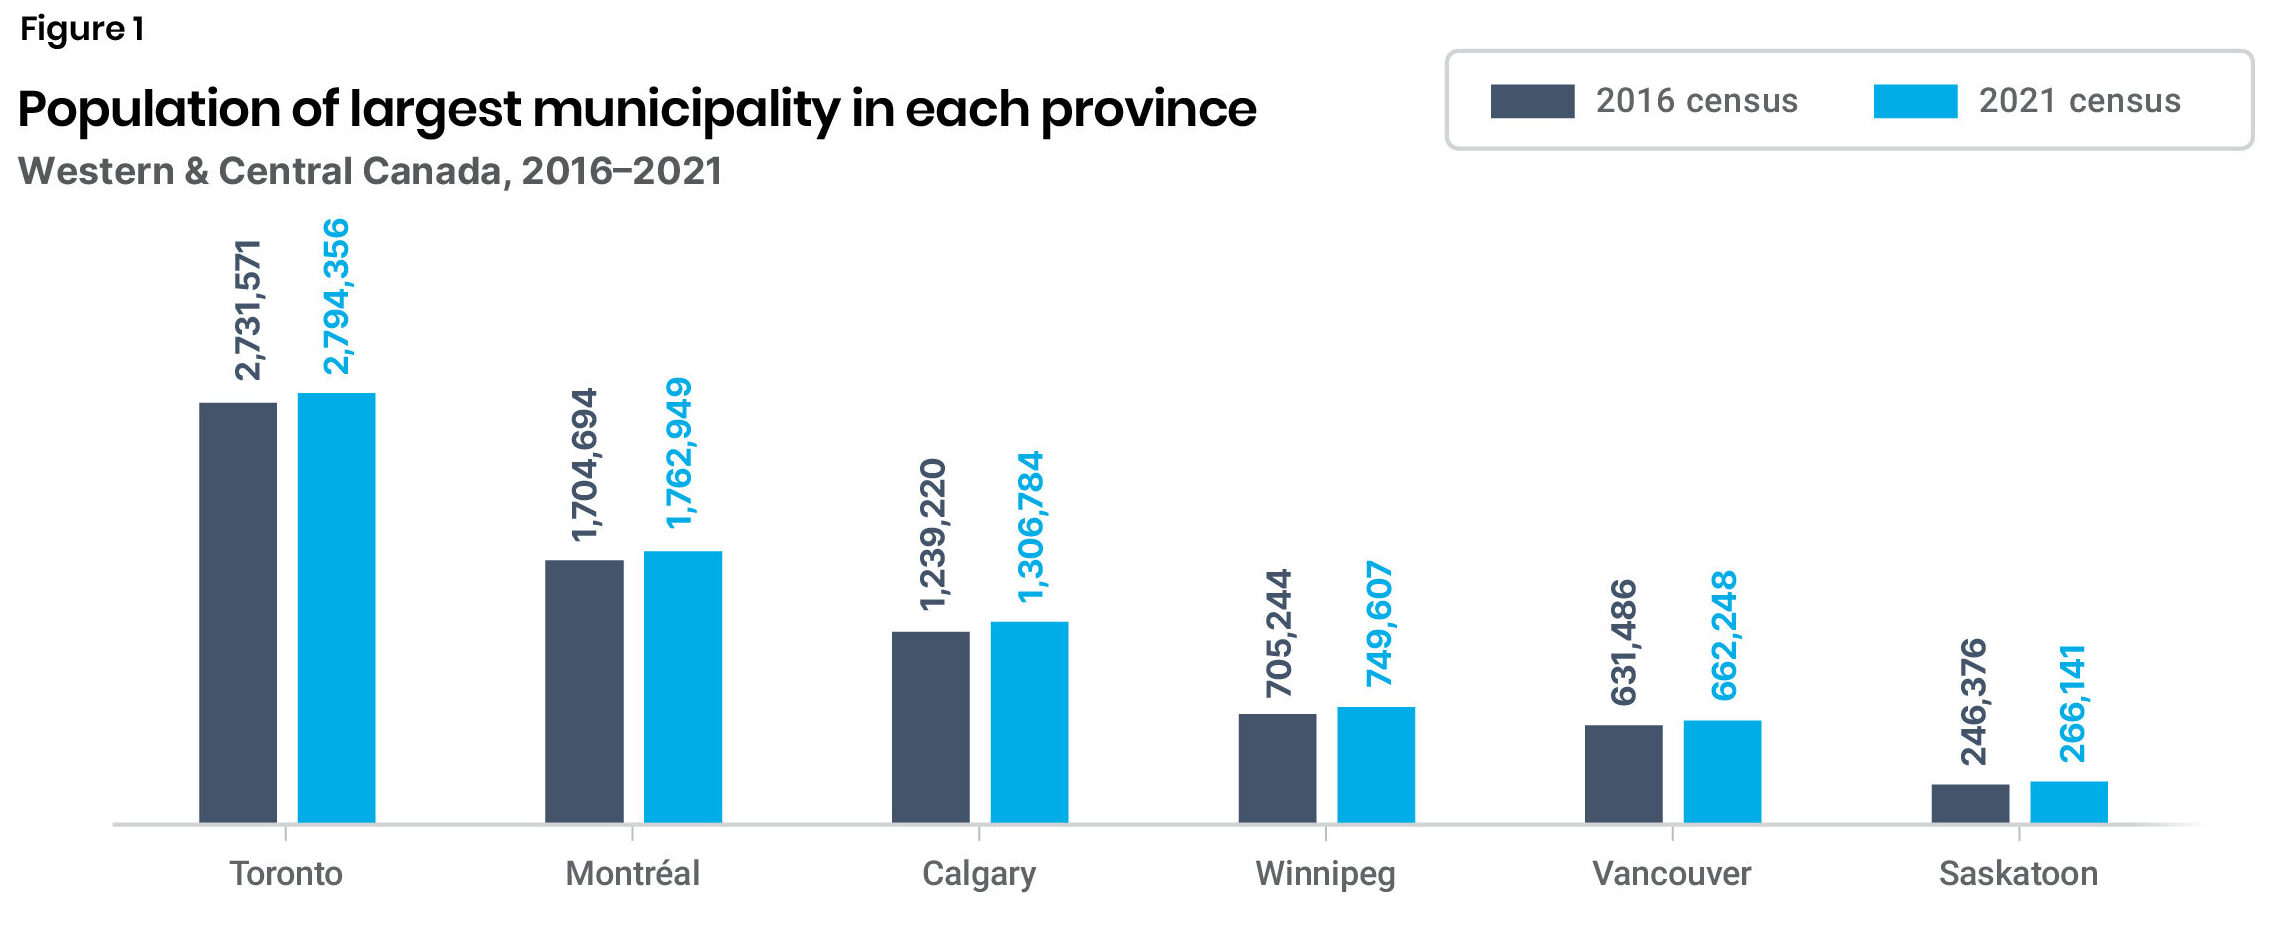
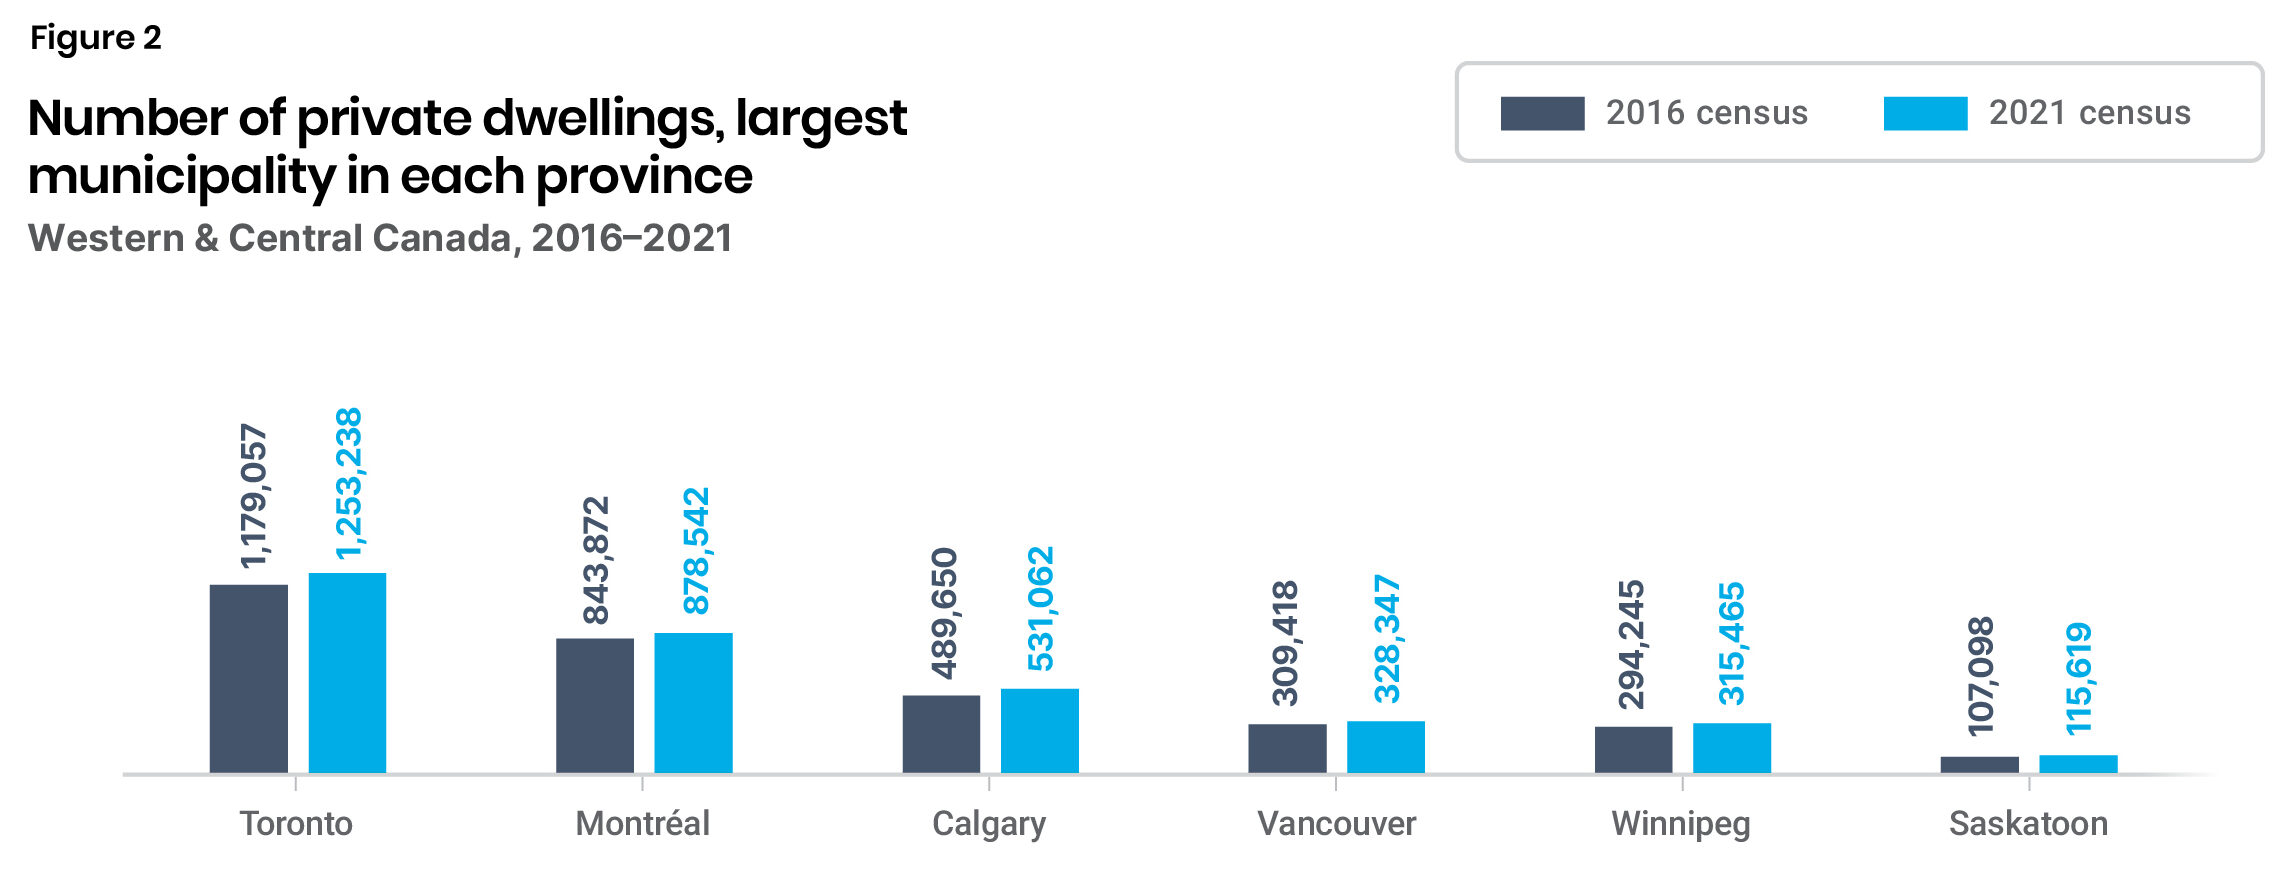
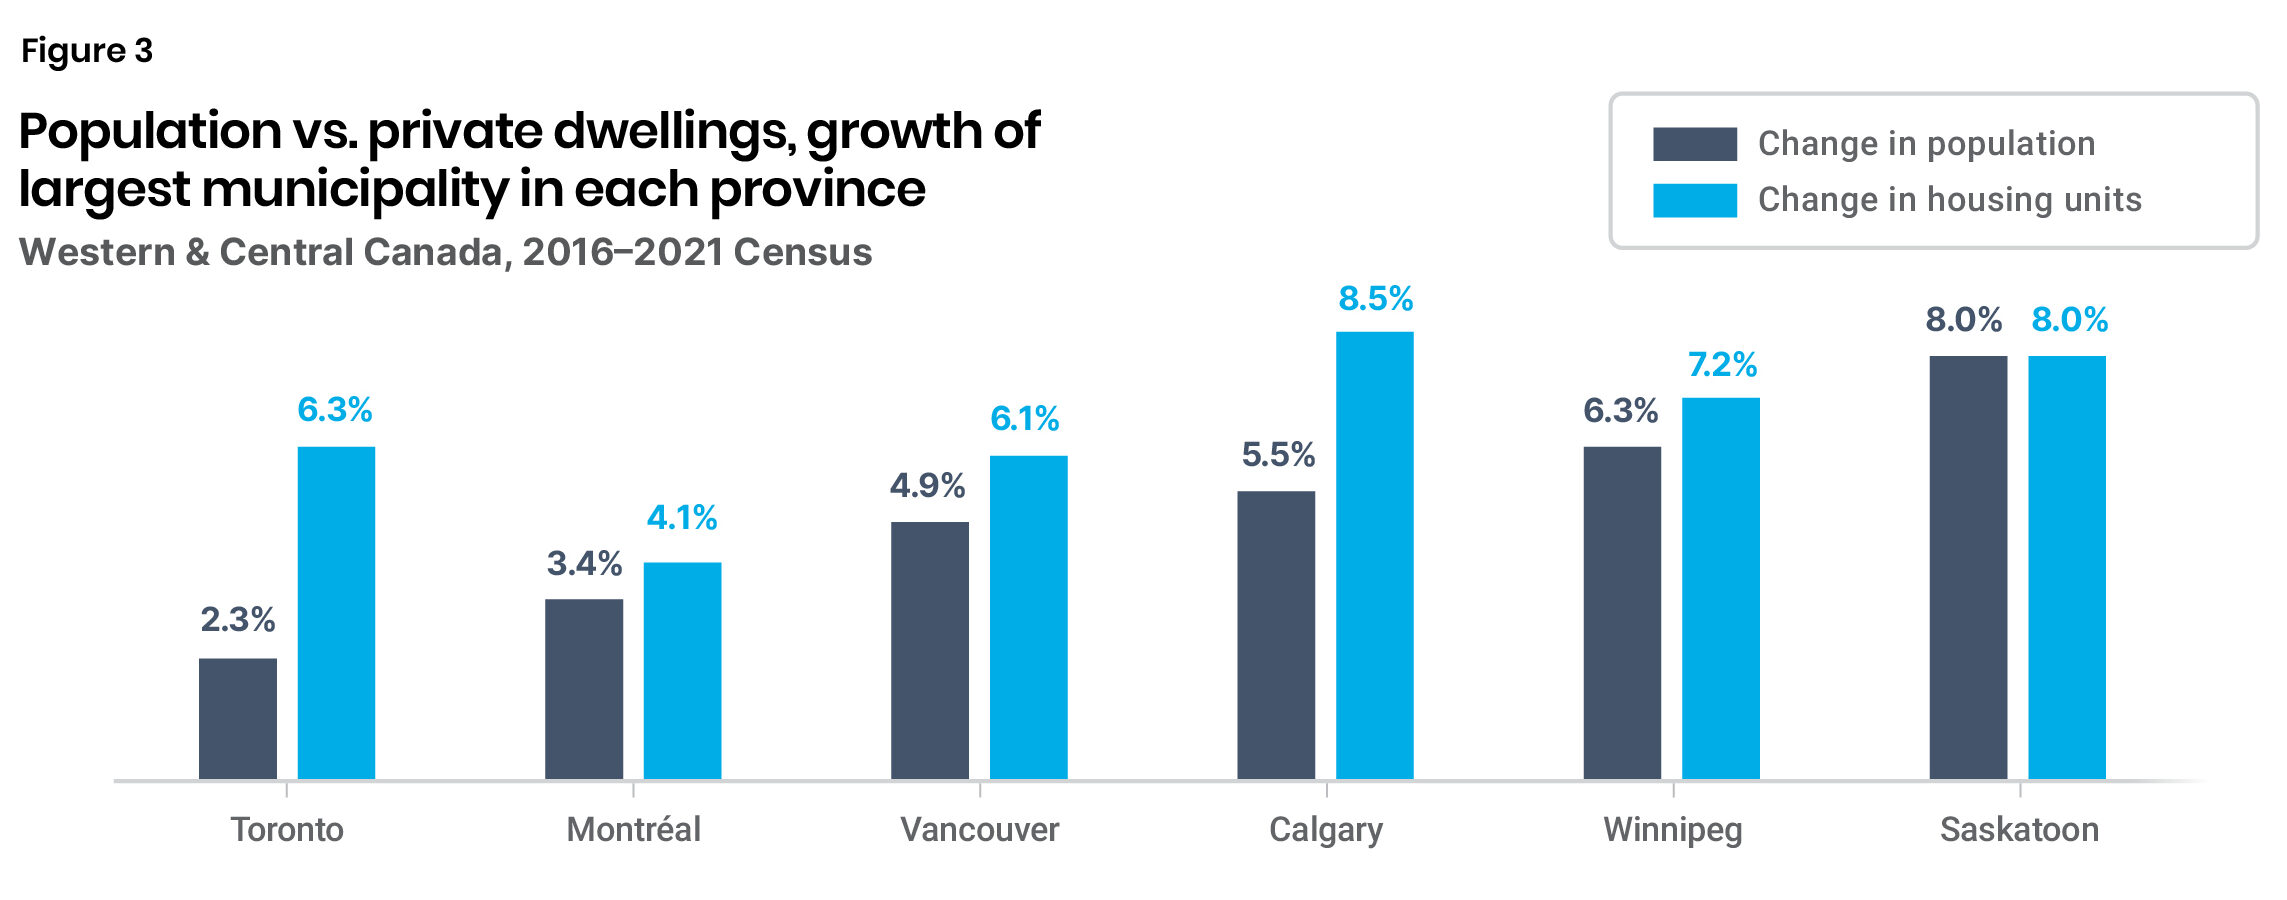
Of the cities in our analysis, Calgary’s population grew the most between the last two censuses—by 67,564 people (Figure 1).2 And only Toronto built more homes (Figure 2).3 Percentagewise, Calgary’s number of residential units grew the most, and only Saskatoon and Winnipeg had faster growing populations (Figure 3).
Sources:
Statistics Canada (2022), “Ranking of the 10 most populated municipalities, 1901 to 2021,” Statistics Canada (February 9) <https://www12.statcan.gc.ca/census-recensement/2021/dp-pd/dv-vd/ribbon-ruban/index-eng.cfm>.
Note:
Total private dwellings includes: single-detached house, semi-detached house, row house, apartment or flat in a duplex, apartment, other single-attached house, movable dwelling.
Source:
Statistics Canada (nd), “Census of Population 2016 and 2021,” Statistics Canada <https://www12.statcan.gc.ca/census-recensement/index-eng.cfm>.
Note:
“Housing units” is total private dwellings, which includes: single-detached house, semi-detached house, row house, apartment or flat in a duplex, apartment, other single-attached house, or movable dwelling.
Source:
Authors’ calculations, based on: Statistics Canada (nd), “Census of Population 2016 and 2021”; Statistics Canada, (2022), “Ranking of the 10 most populated municipalities, 1901 to 2021,” Statistics Canada (February 9) <https://www12.statcan.gc.ca/census-recensement/2021/dp-pd/dv-vd/ribbon-ruban/index-eng.cfm>.
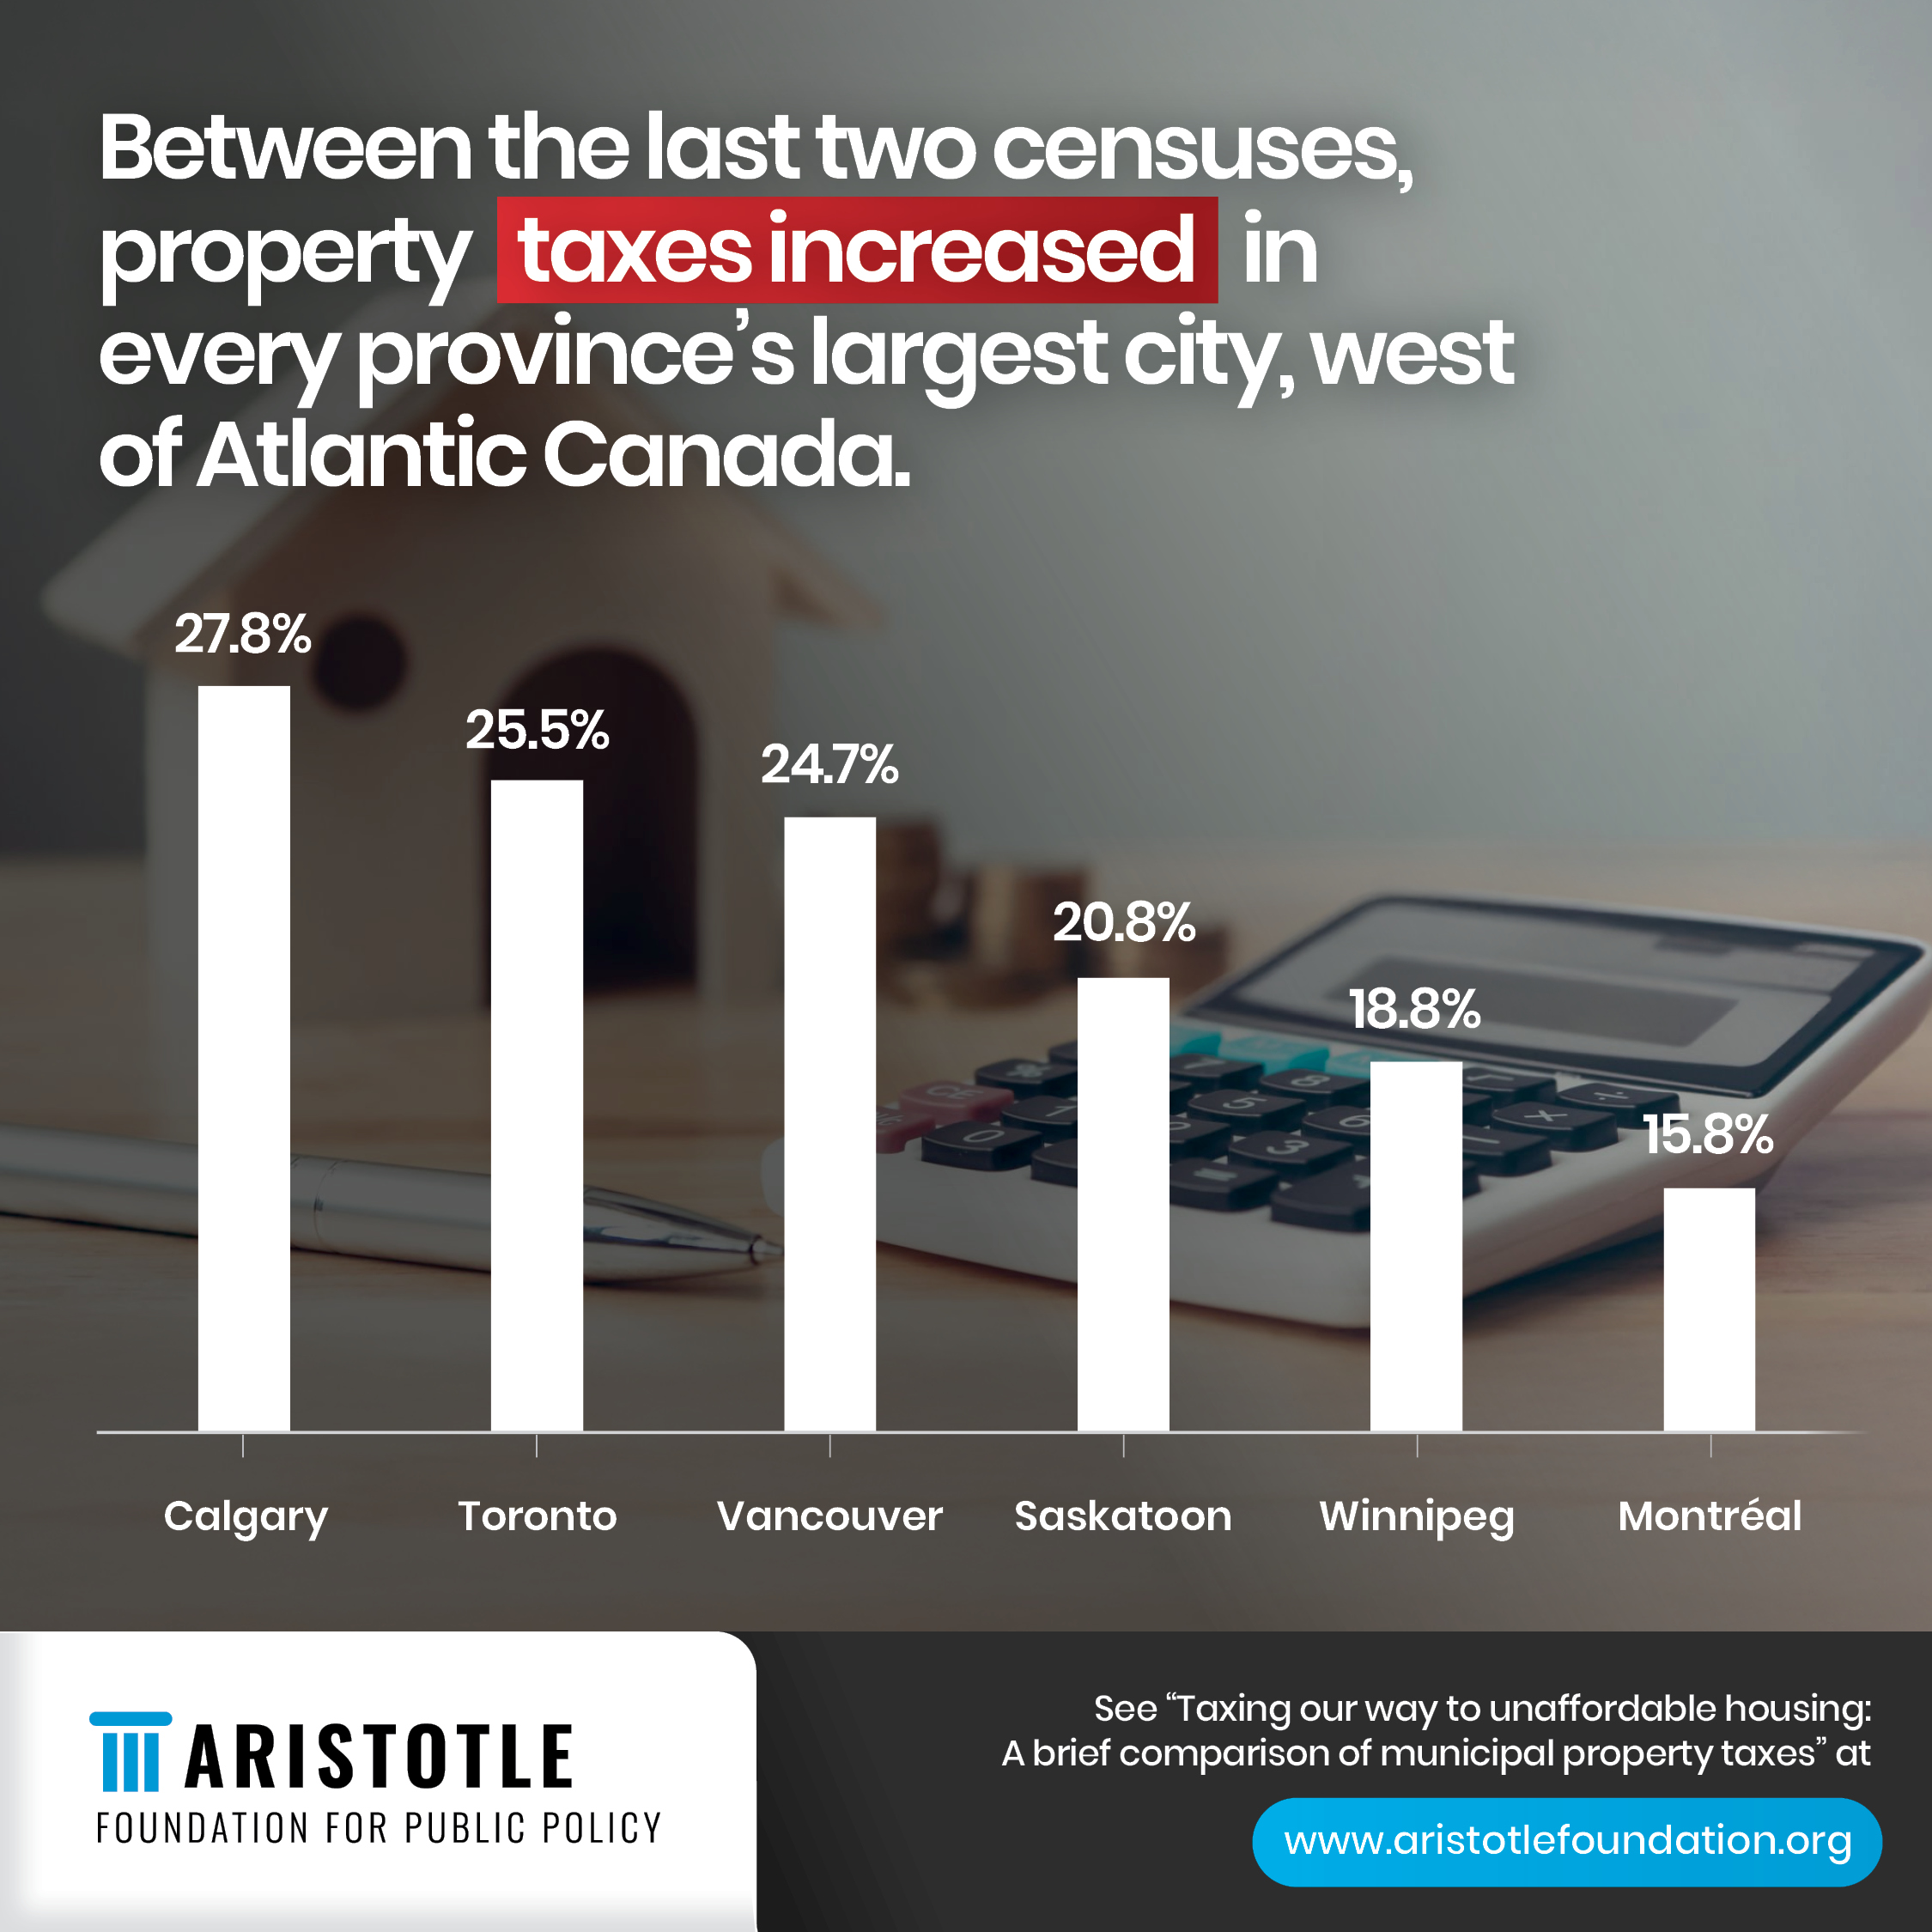
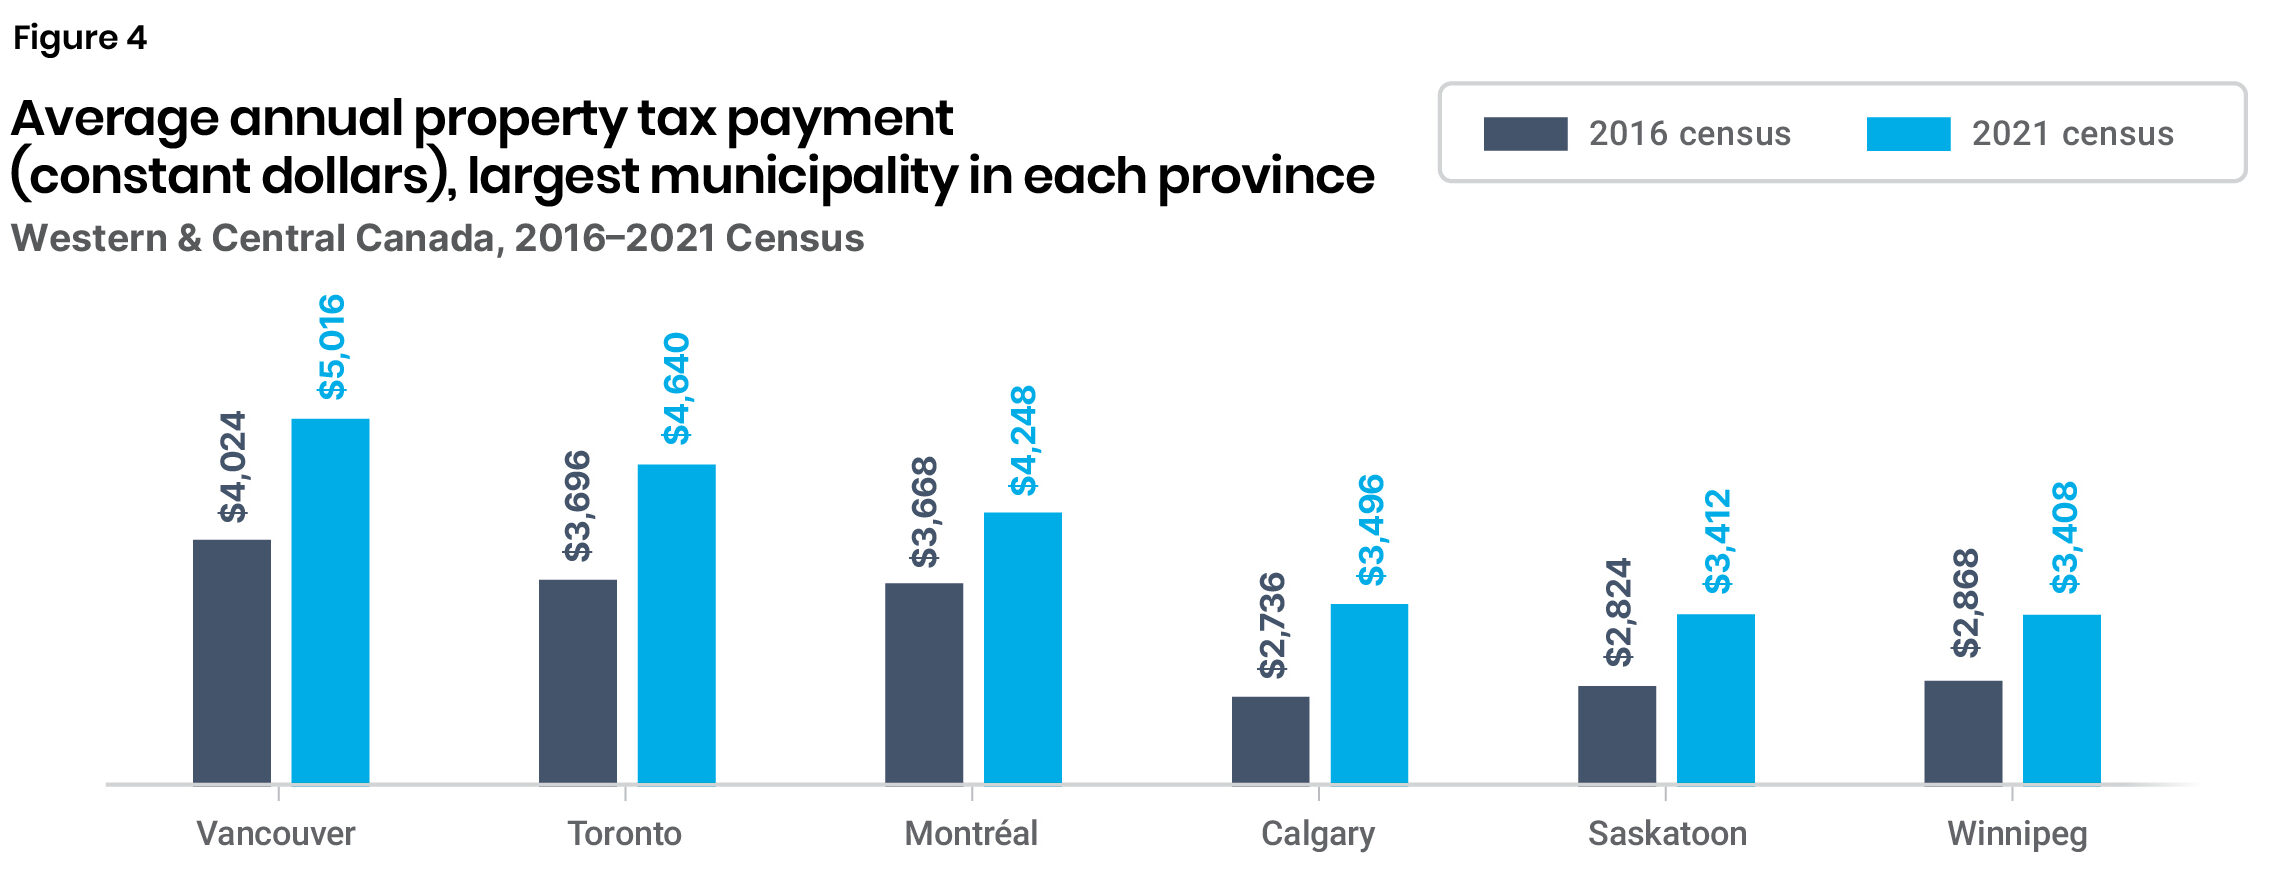
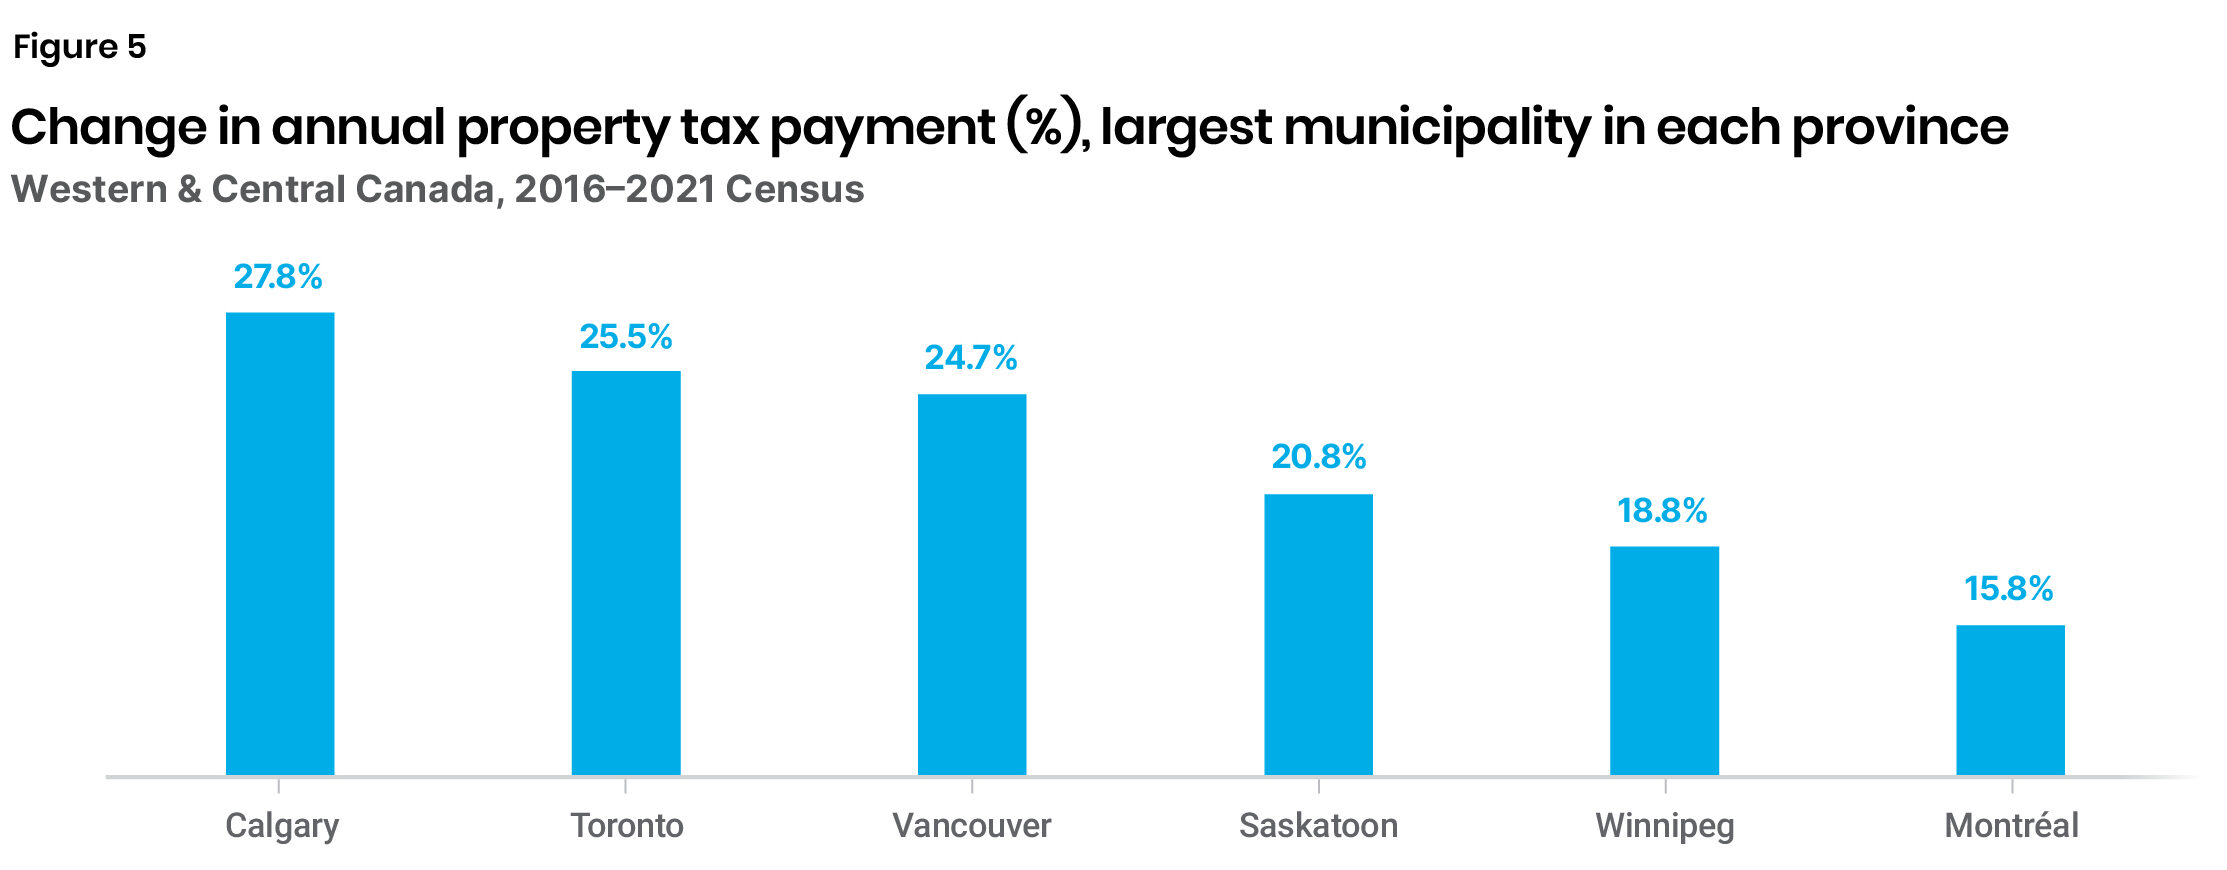
Between 2016 and 2021, all cities in our analysis experienced notable property tax increases (Figure 4), with percentage growth ranging from 16 percent to 28 percent. The most significant percentage growth occurred in Calgary, where the property tax rose from $2,736 to $3,496—a 28 percent jump in five years, between the 2016 and 2021 censuses (Figure 5), and nearly twice the rate hike of Montreal.
Note:
Constant Canadian dollars, as of 2020, adjusted for inflation.
Source:
Statistics Canada custom tabulations from the “Census of Population 2016 and 2021” data.
Note:
Constant Canadian dollars, as of 2020, adjusted for inflation.
Source:
Authors’ calculations, based on Statistics Canada custom tabulations from the “Census of Population 2016 and 2021” data.
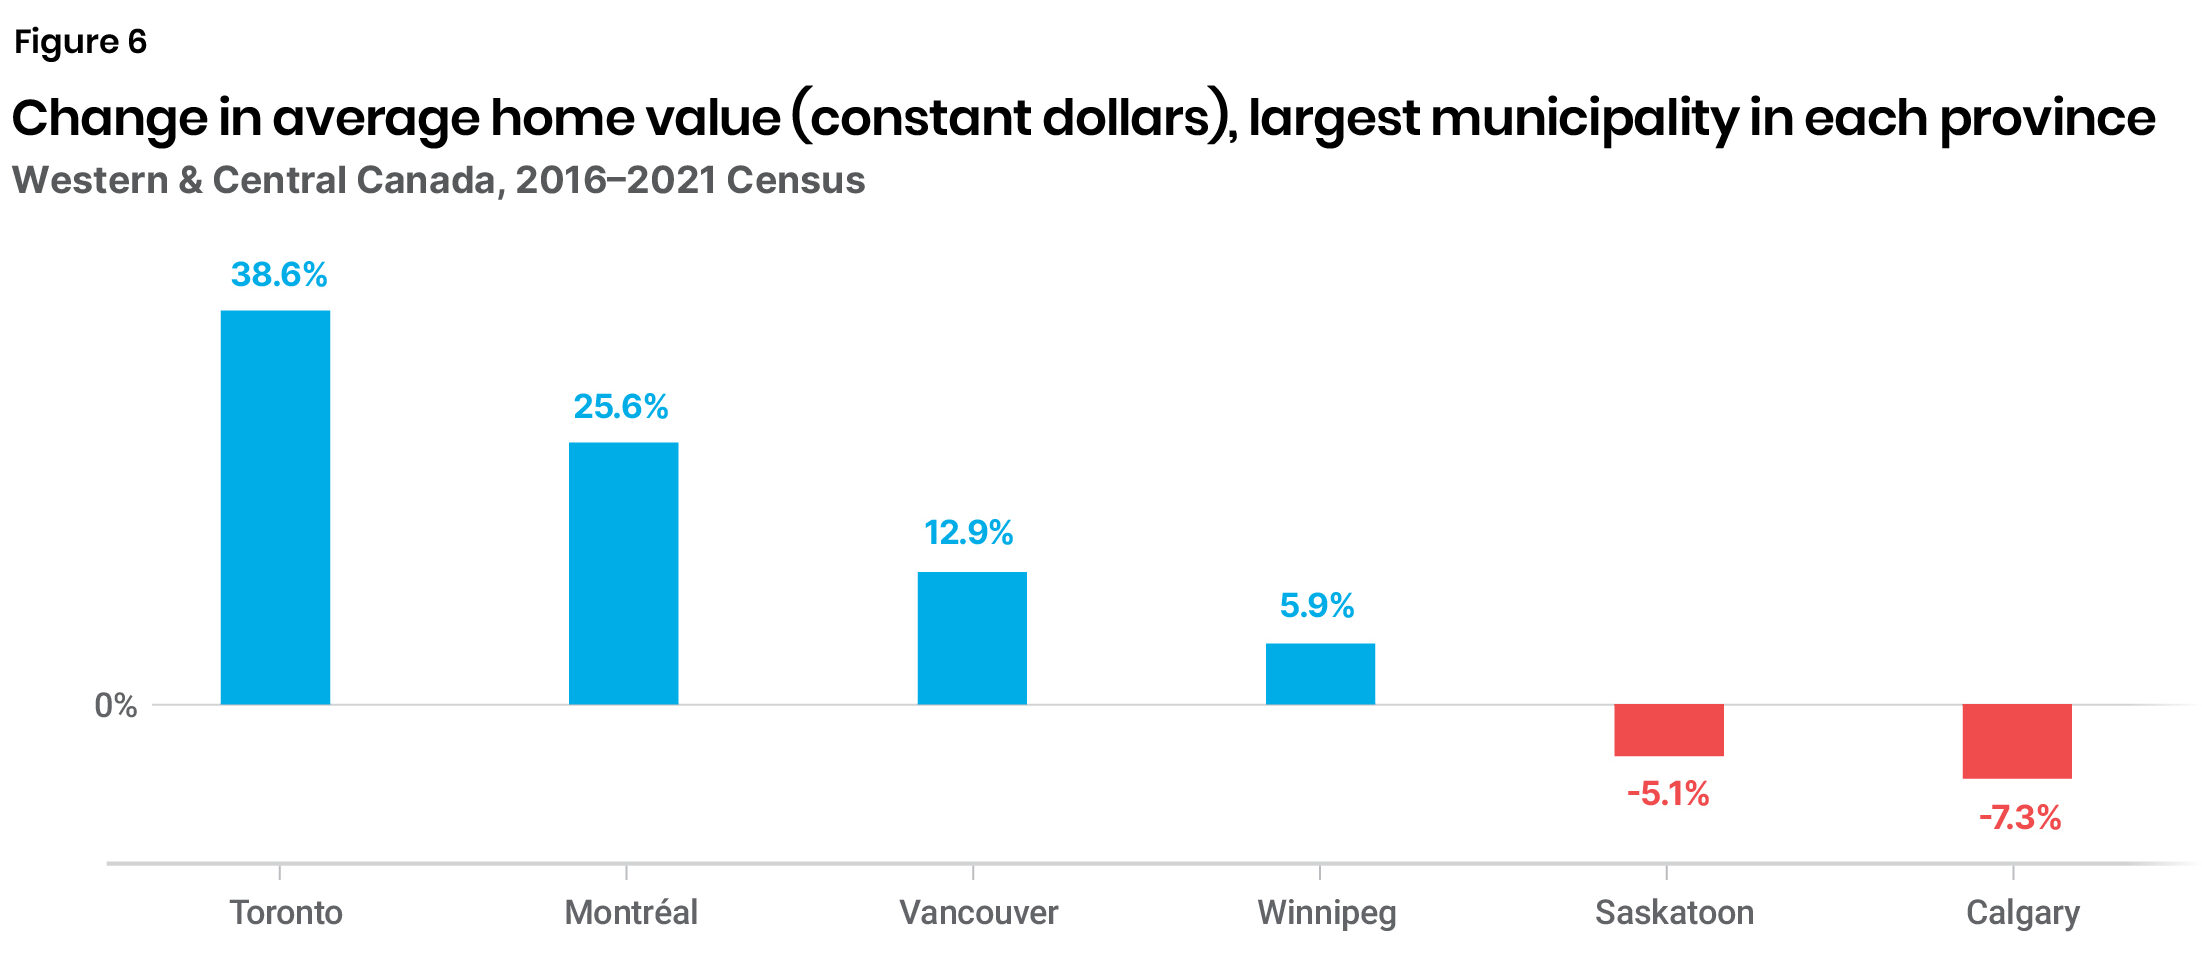
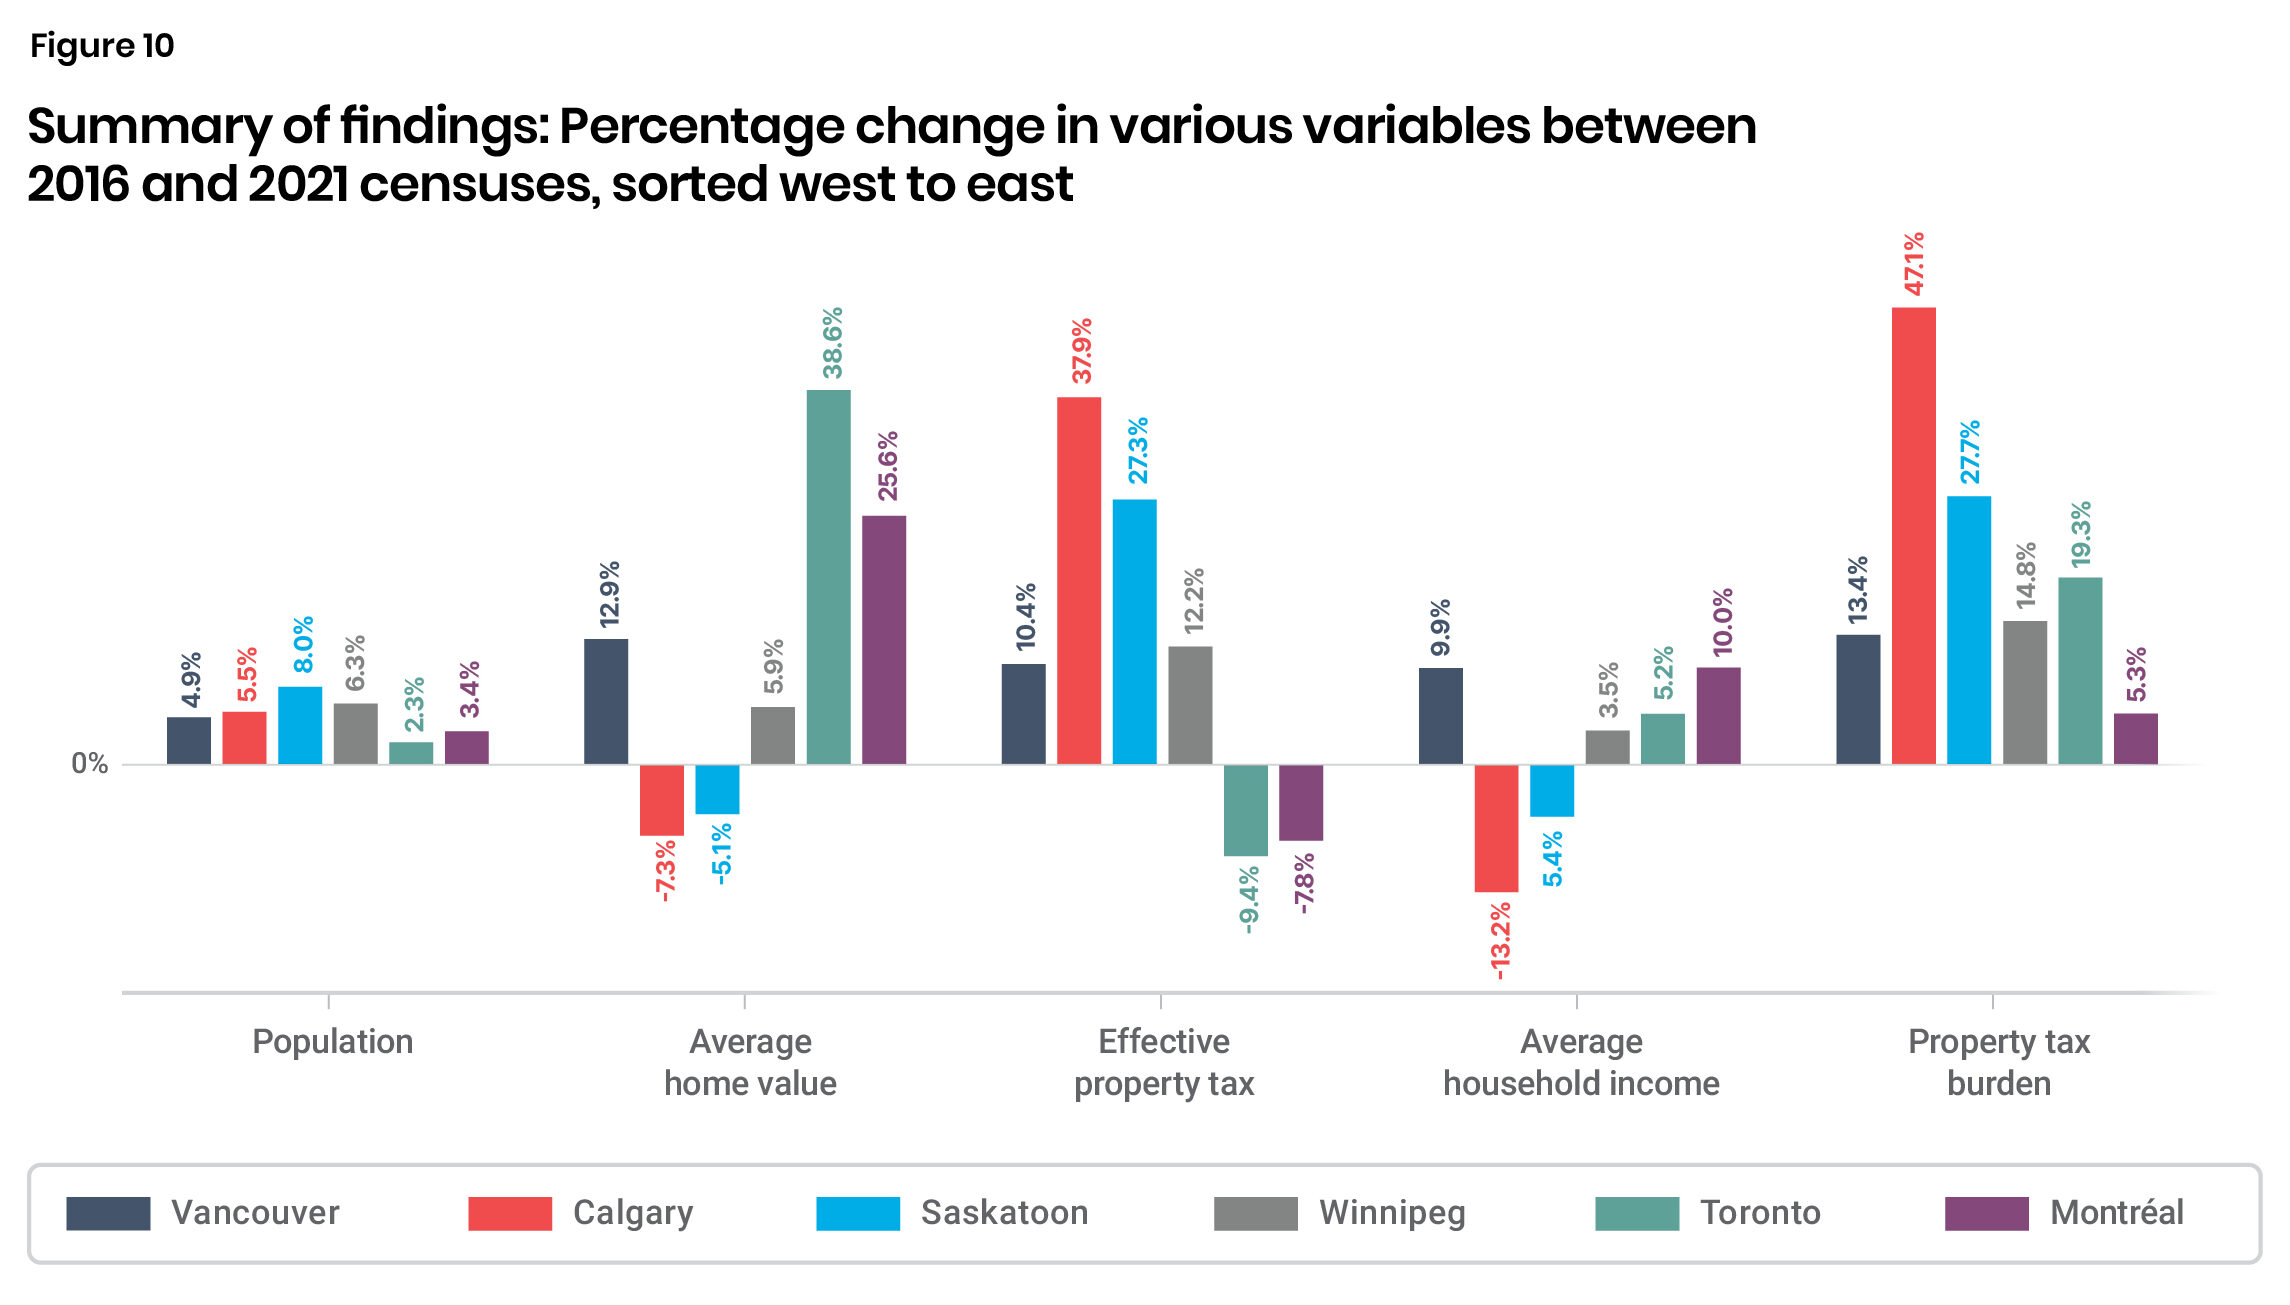
Given rising property taxes, one might assume that housing prices are also rising across the board, but that is not the case. While Toronto and Montreal saw tremendous real estate appreciation between the last censuses (38.6 percent and 25.6 percent, respectively), the average home in Saskatoon and Calgary lost value (-5 percent and -7.3 percent, respectively) (Figure 6). See Figure A1 in the Appendix for details.
Note:
Constant Canadian dollars, as of 2020, adjusted for inflation.
Source:
Authors’ calculations, based on Statistics Canada custom tabulations from the “Census of Population 2016 and 2021” data.
In light of changes to the market value of home prices, it is worth exploring property taxes as a percentage of home value—what is called the “effective rate.” The nominal rate is the property tax rate given by each municipality; it is applied to the assessed value of the property. However, assessment practices vary by municipality, so the effective rate—i.e., the implied rate residents would be paying on the actual value of their property—is the only fair way to make comparisons between municipalities.
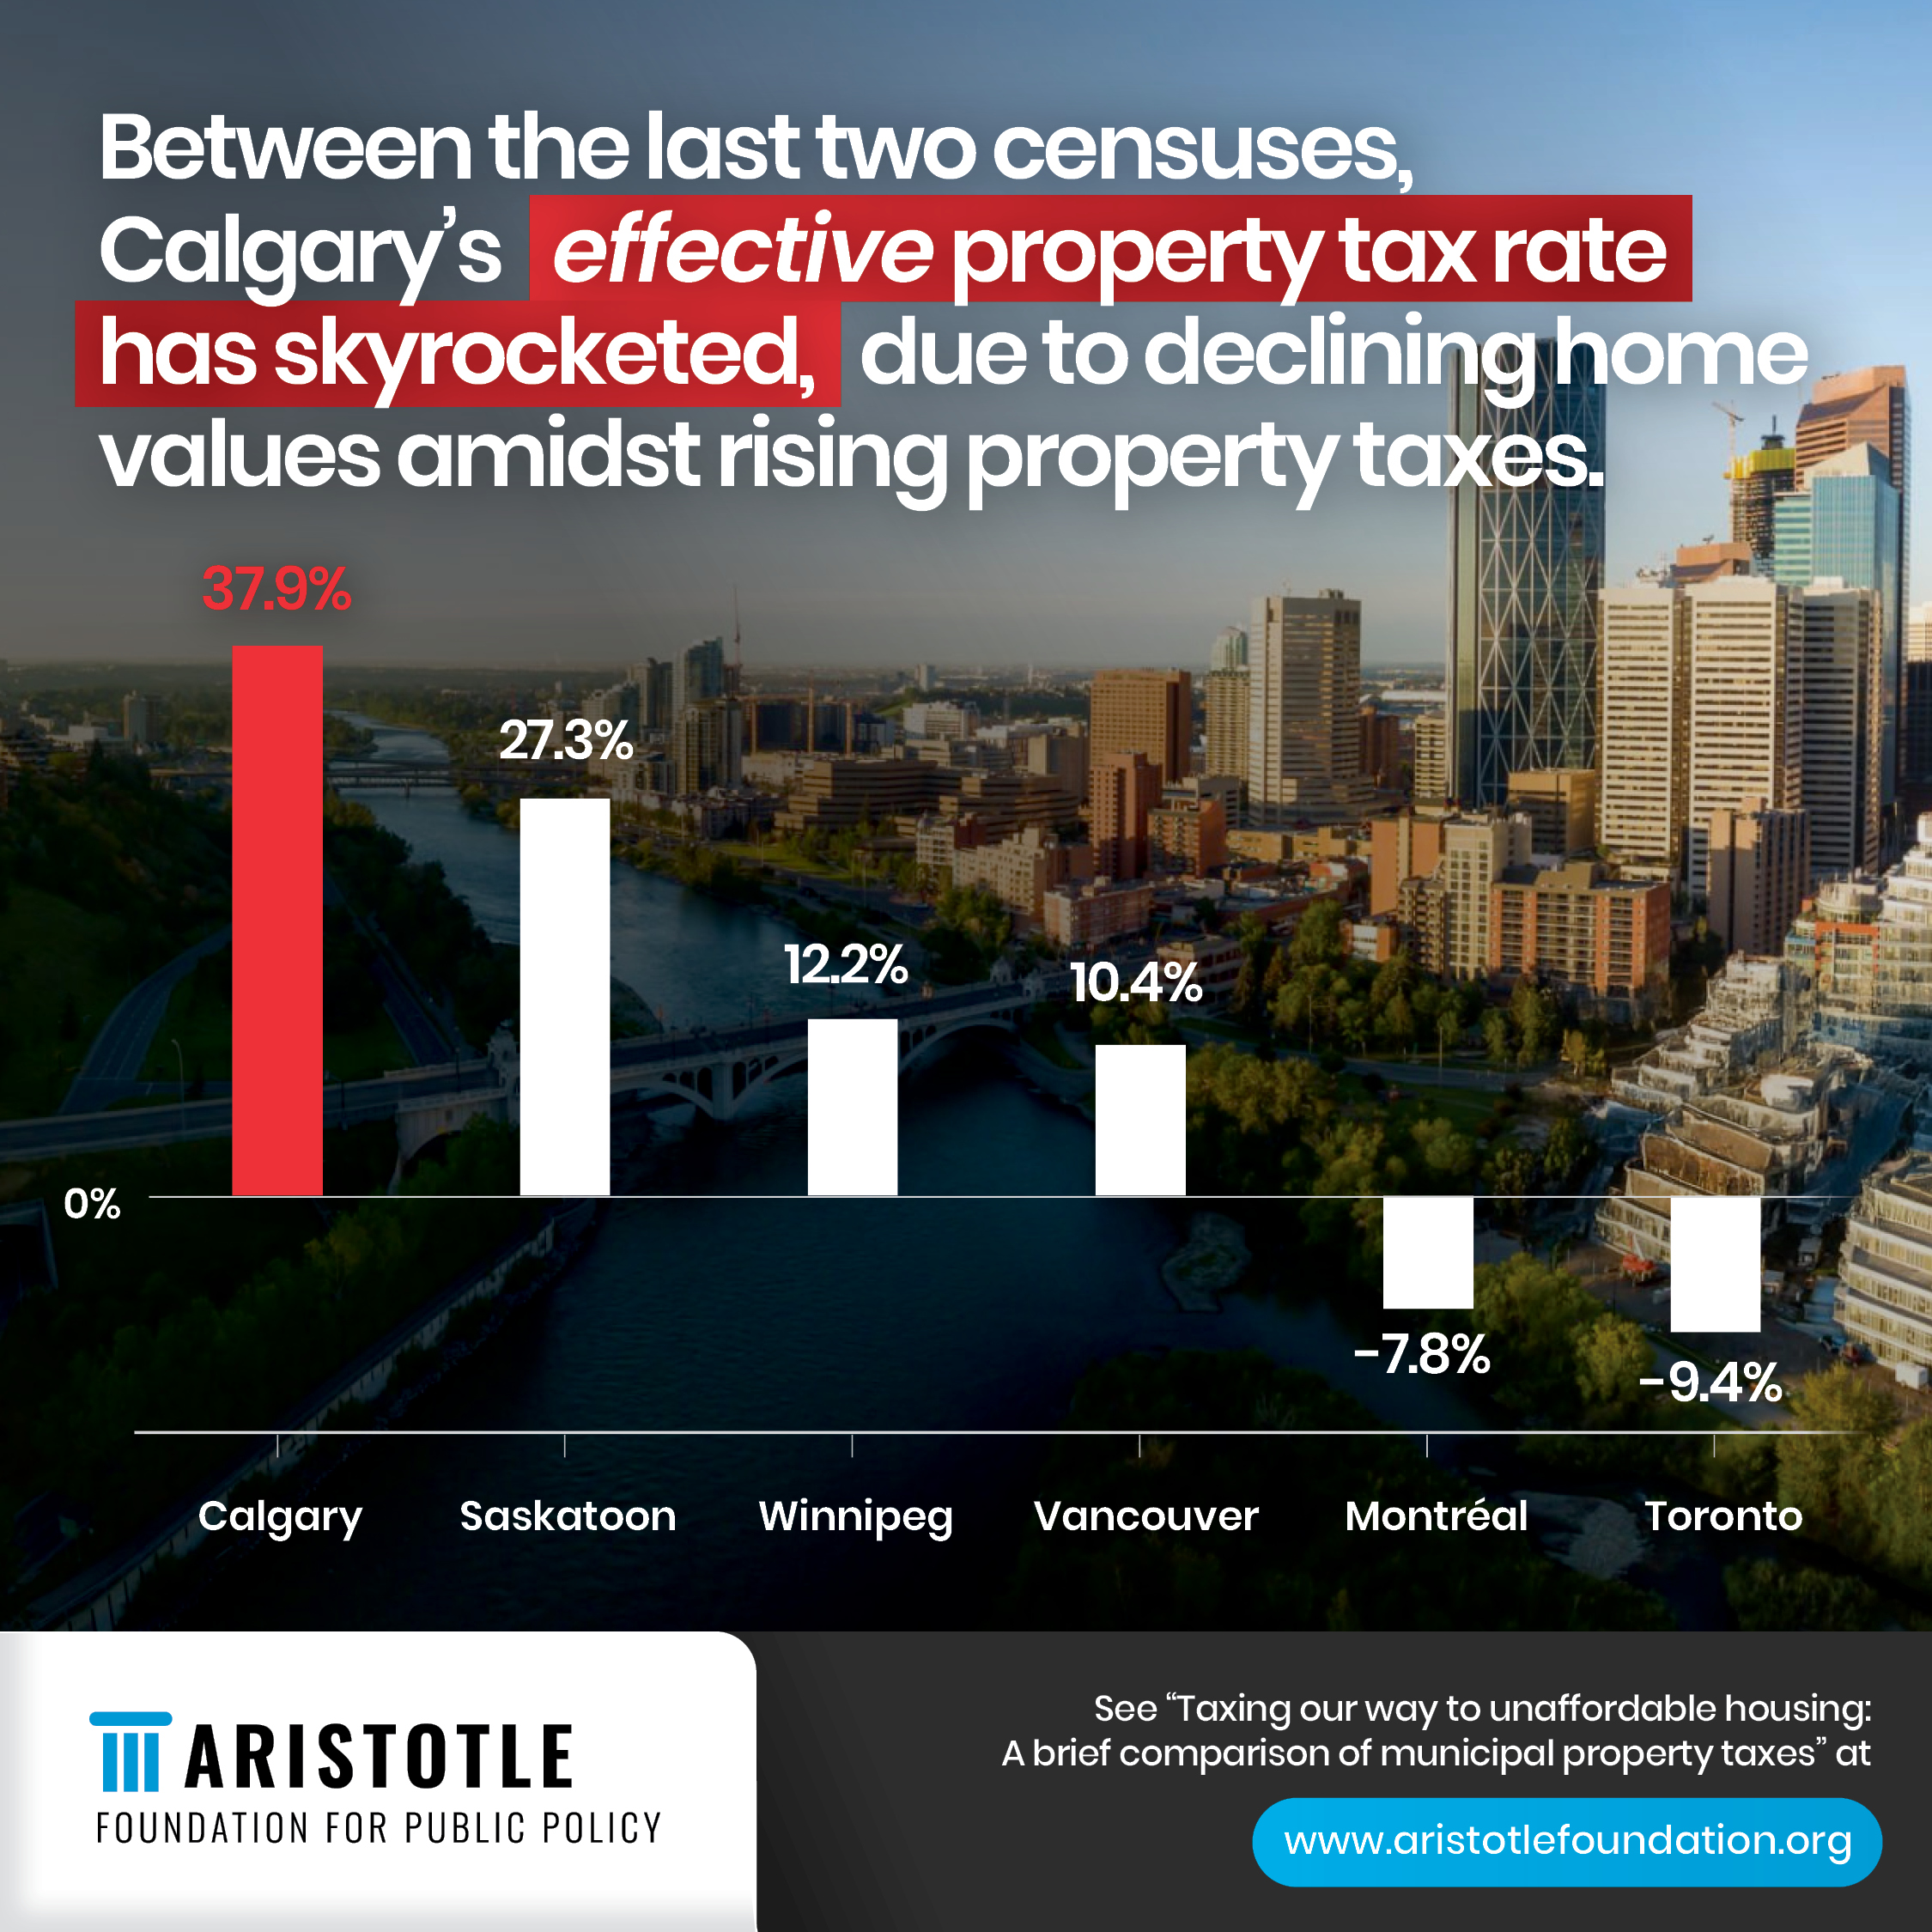
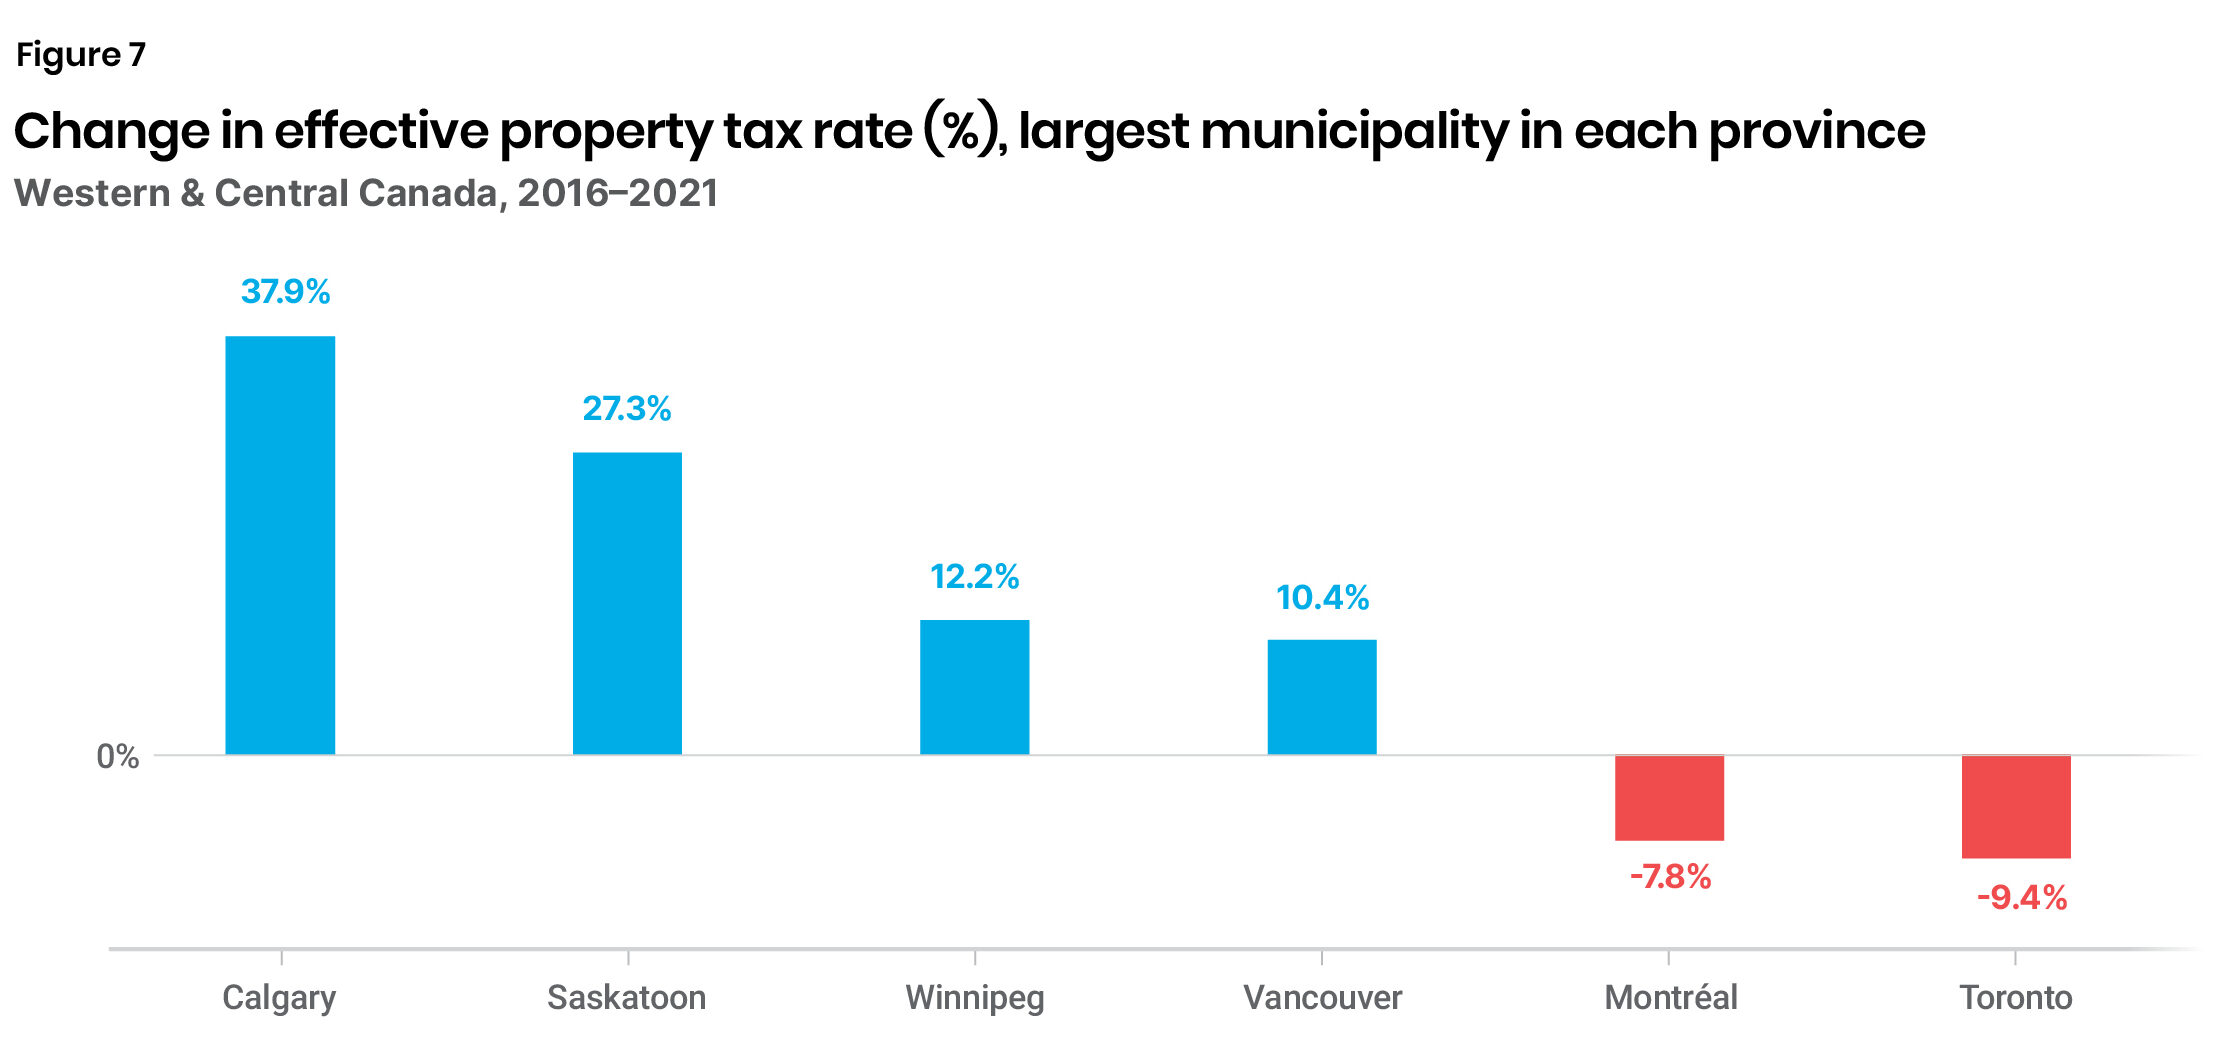
Calgary’s effective property tax rate had the most significant increase (37.9 percent) between the 2016 and 2021 census periods. Saskatoon, at 27.3 percent, also saw a substantial rise in property tax pressure. Winnipeg and Vancouver also saw moderate increases, suggesting a general upward trend in western cities. Conversely, Montreal and Toronto both saw their effective property tax rates decline—by nearly 8 percent and 9.4 percent, respectively (Figure 7)—as a result of home prices rising higher than property taxes. See Table A1 in the Appendix for details.
Note:
- Effective tax rate = property taxes as a percentage of the estimated market value of the dwelling.
- Constant Canadian dollars, as of 2020, adjusted for inflation.
Source:
Authors’ calculations, based on Statistics Canada custom tabulations from the “Census of Population 2016 and 2021” data.
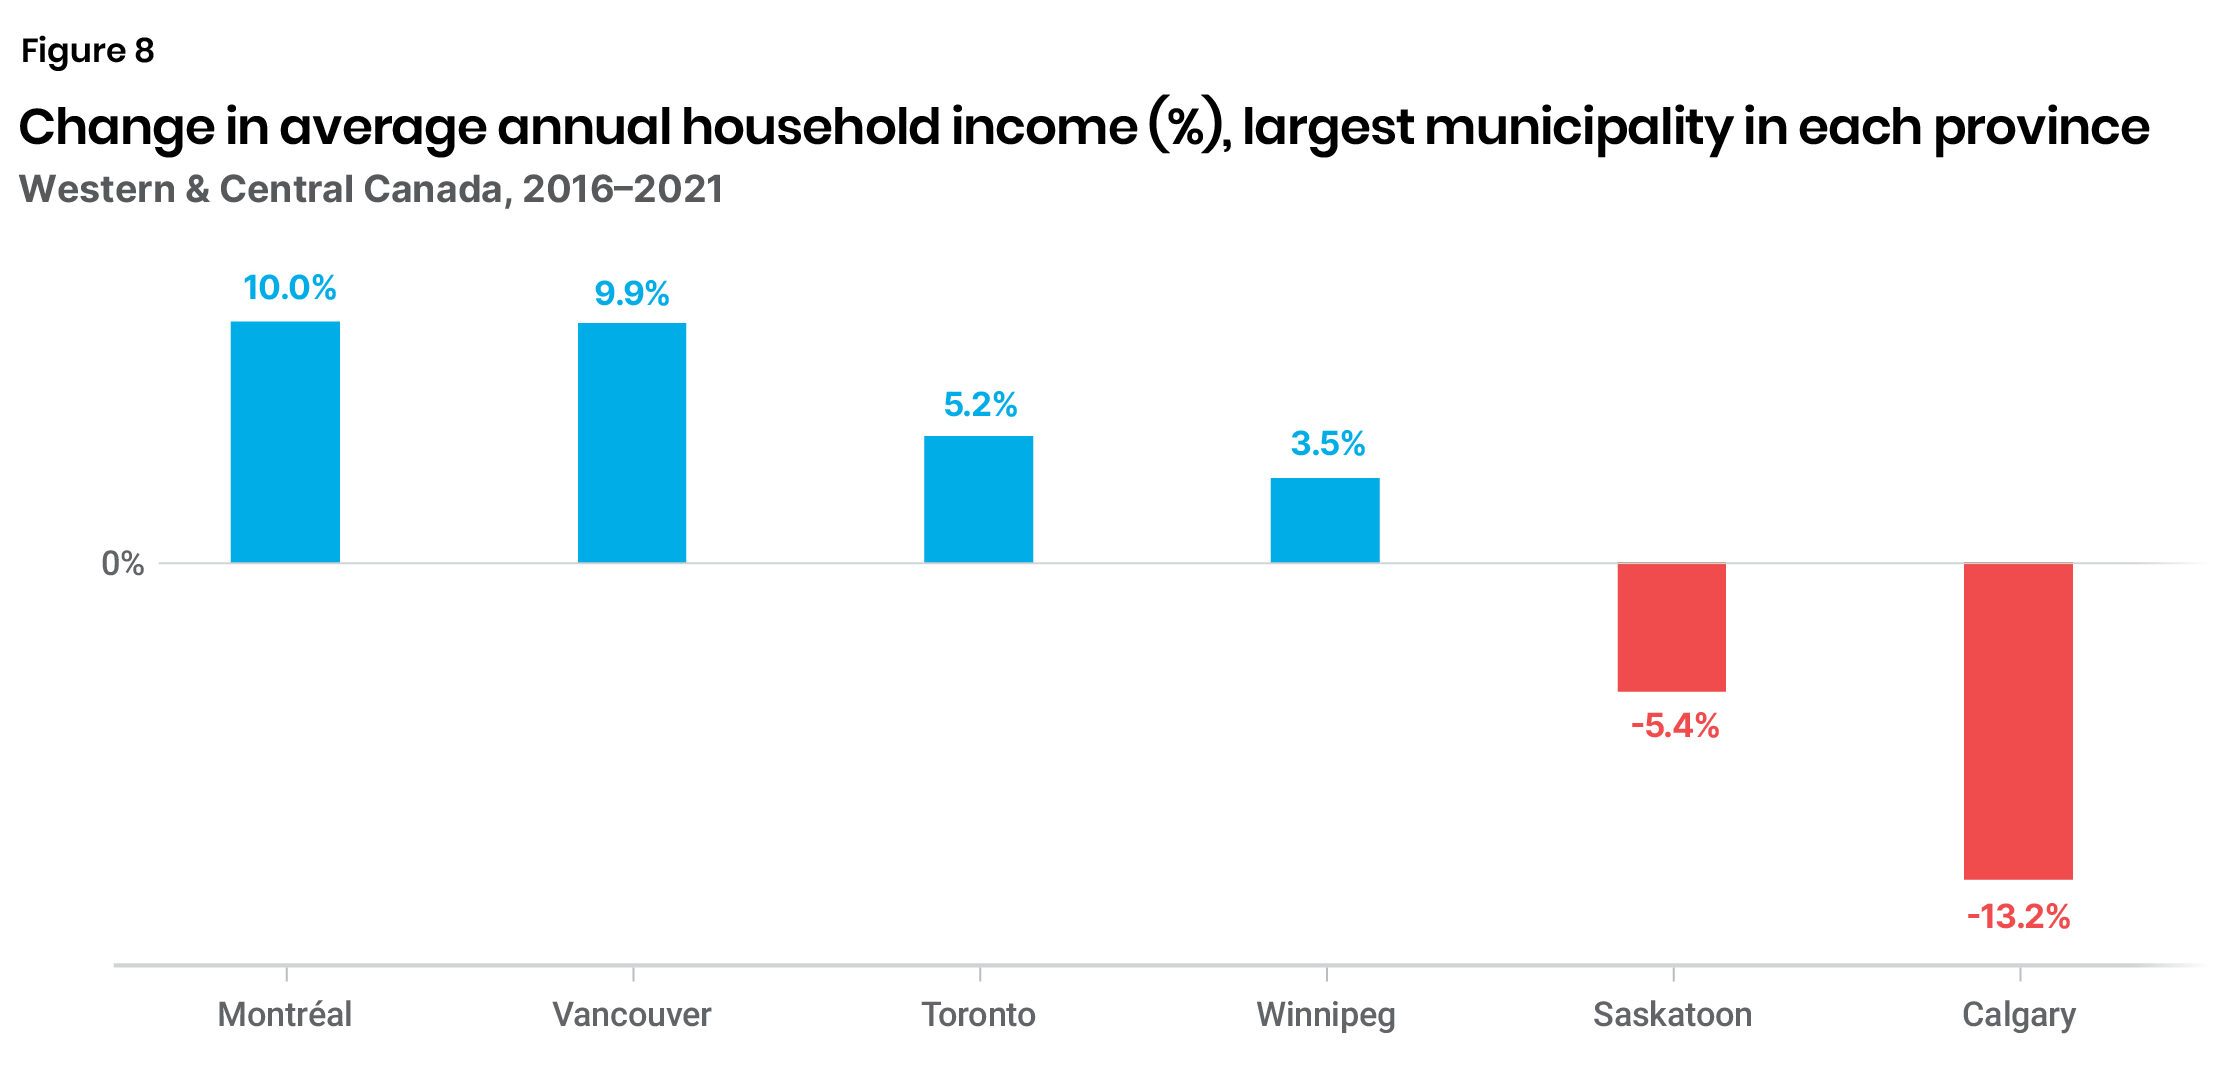
Yet, from an affordability perspective, the total property tax burden is an even more important metric than the nominal or effective tax rates. To calculate the tax burden, we need to consider income. Montreal and Vancouver saw the most significant percentage increase in household income (10 percent), while Calgary experienced the most significant decline (-13 percent) (Figure 8). See Figure A2 in the Appendix for details.
Note:
Constant Canadian dollars, as of 2020, adjusted for inflation.
Source:
Authors’ calculations, based on Statistics Canada custom tabulations from the “Census of Population 2016 and 2021” data.
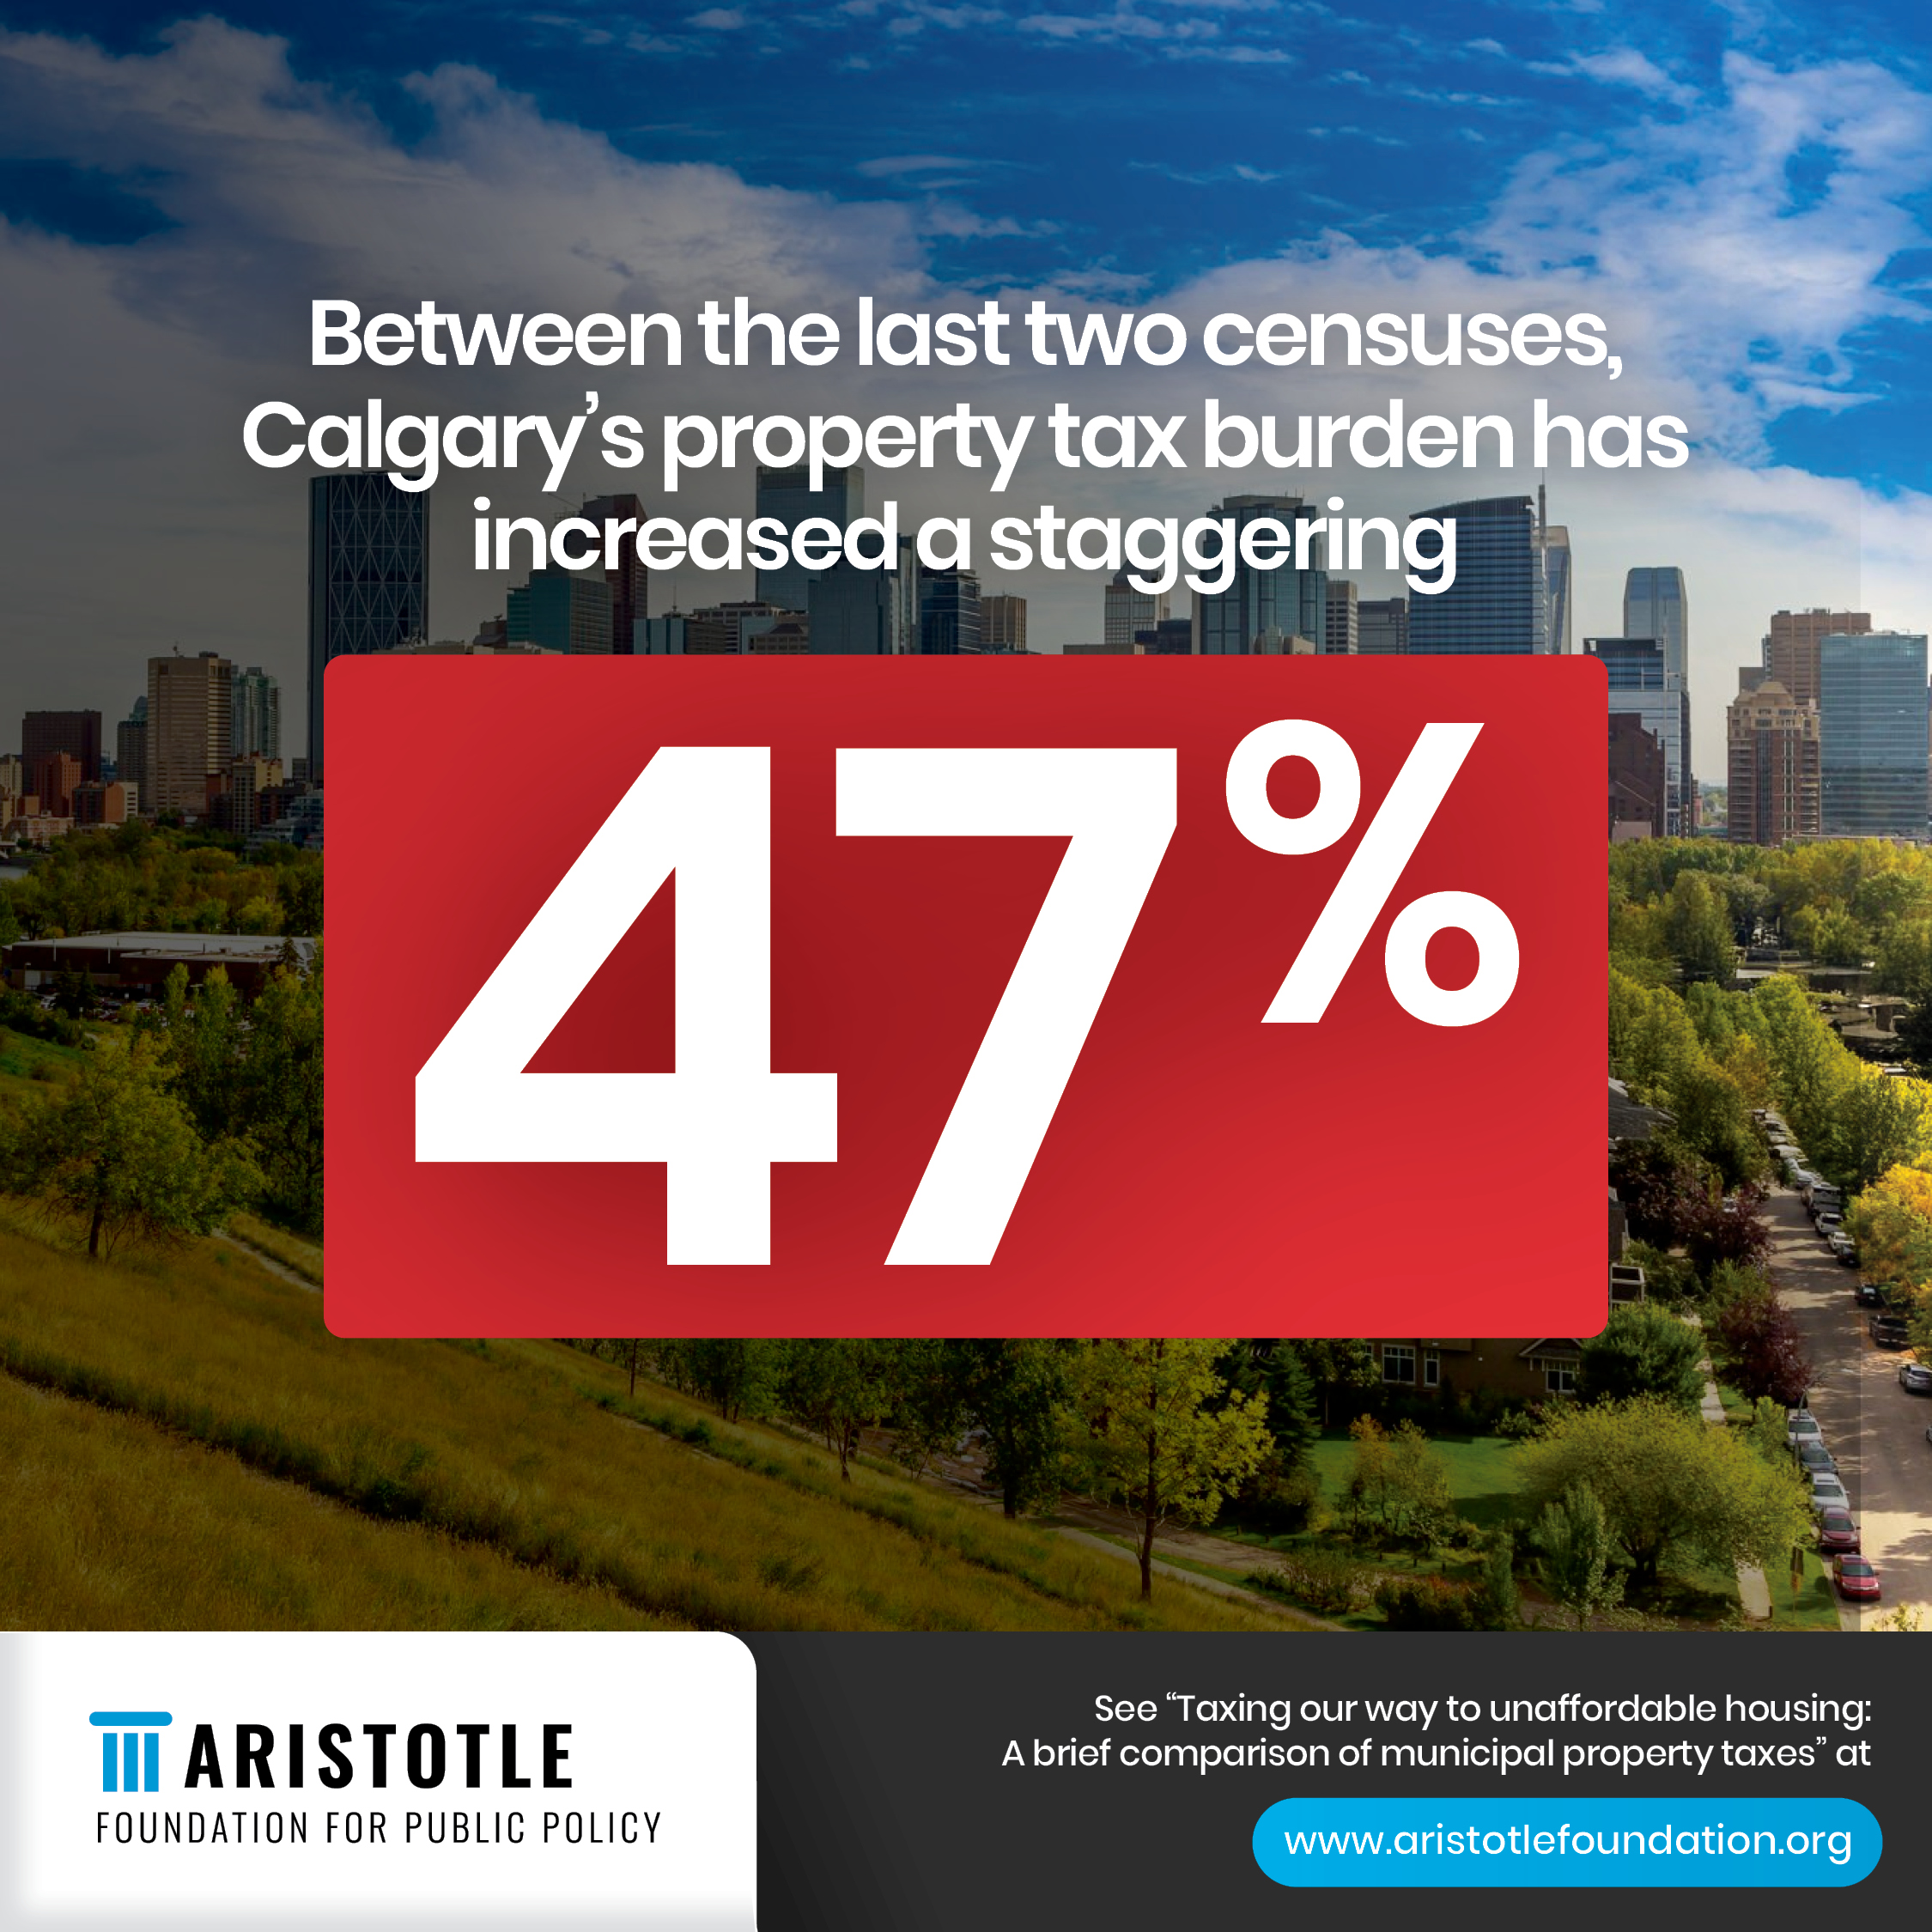
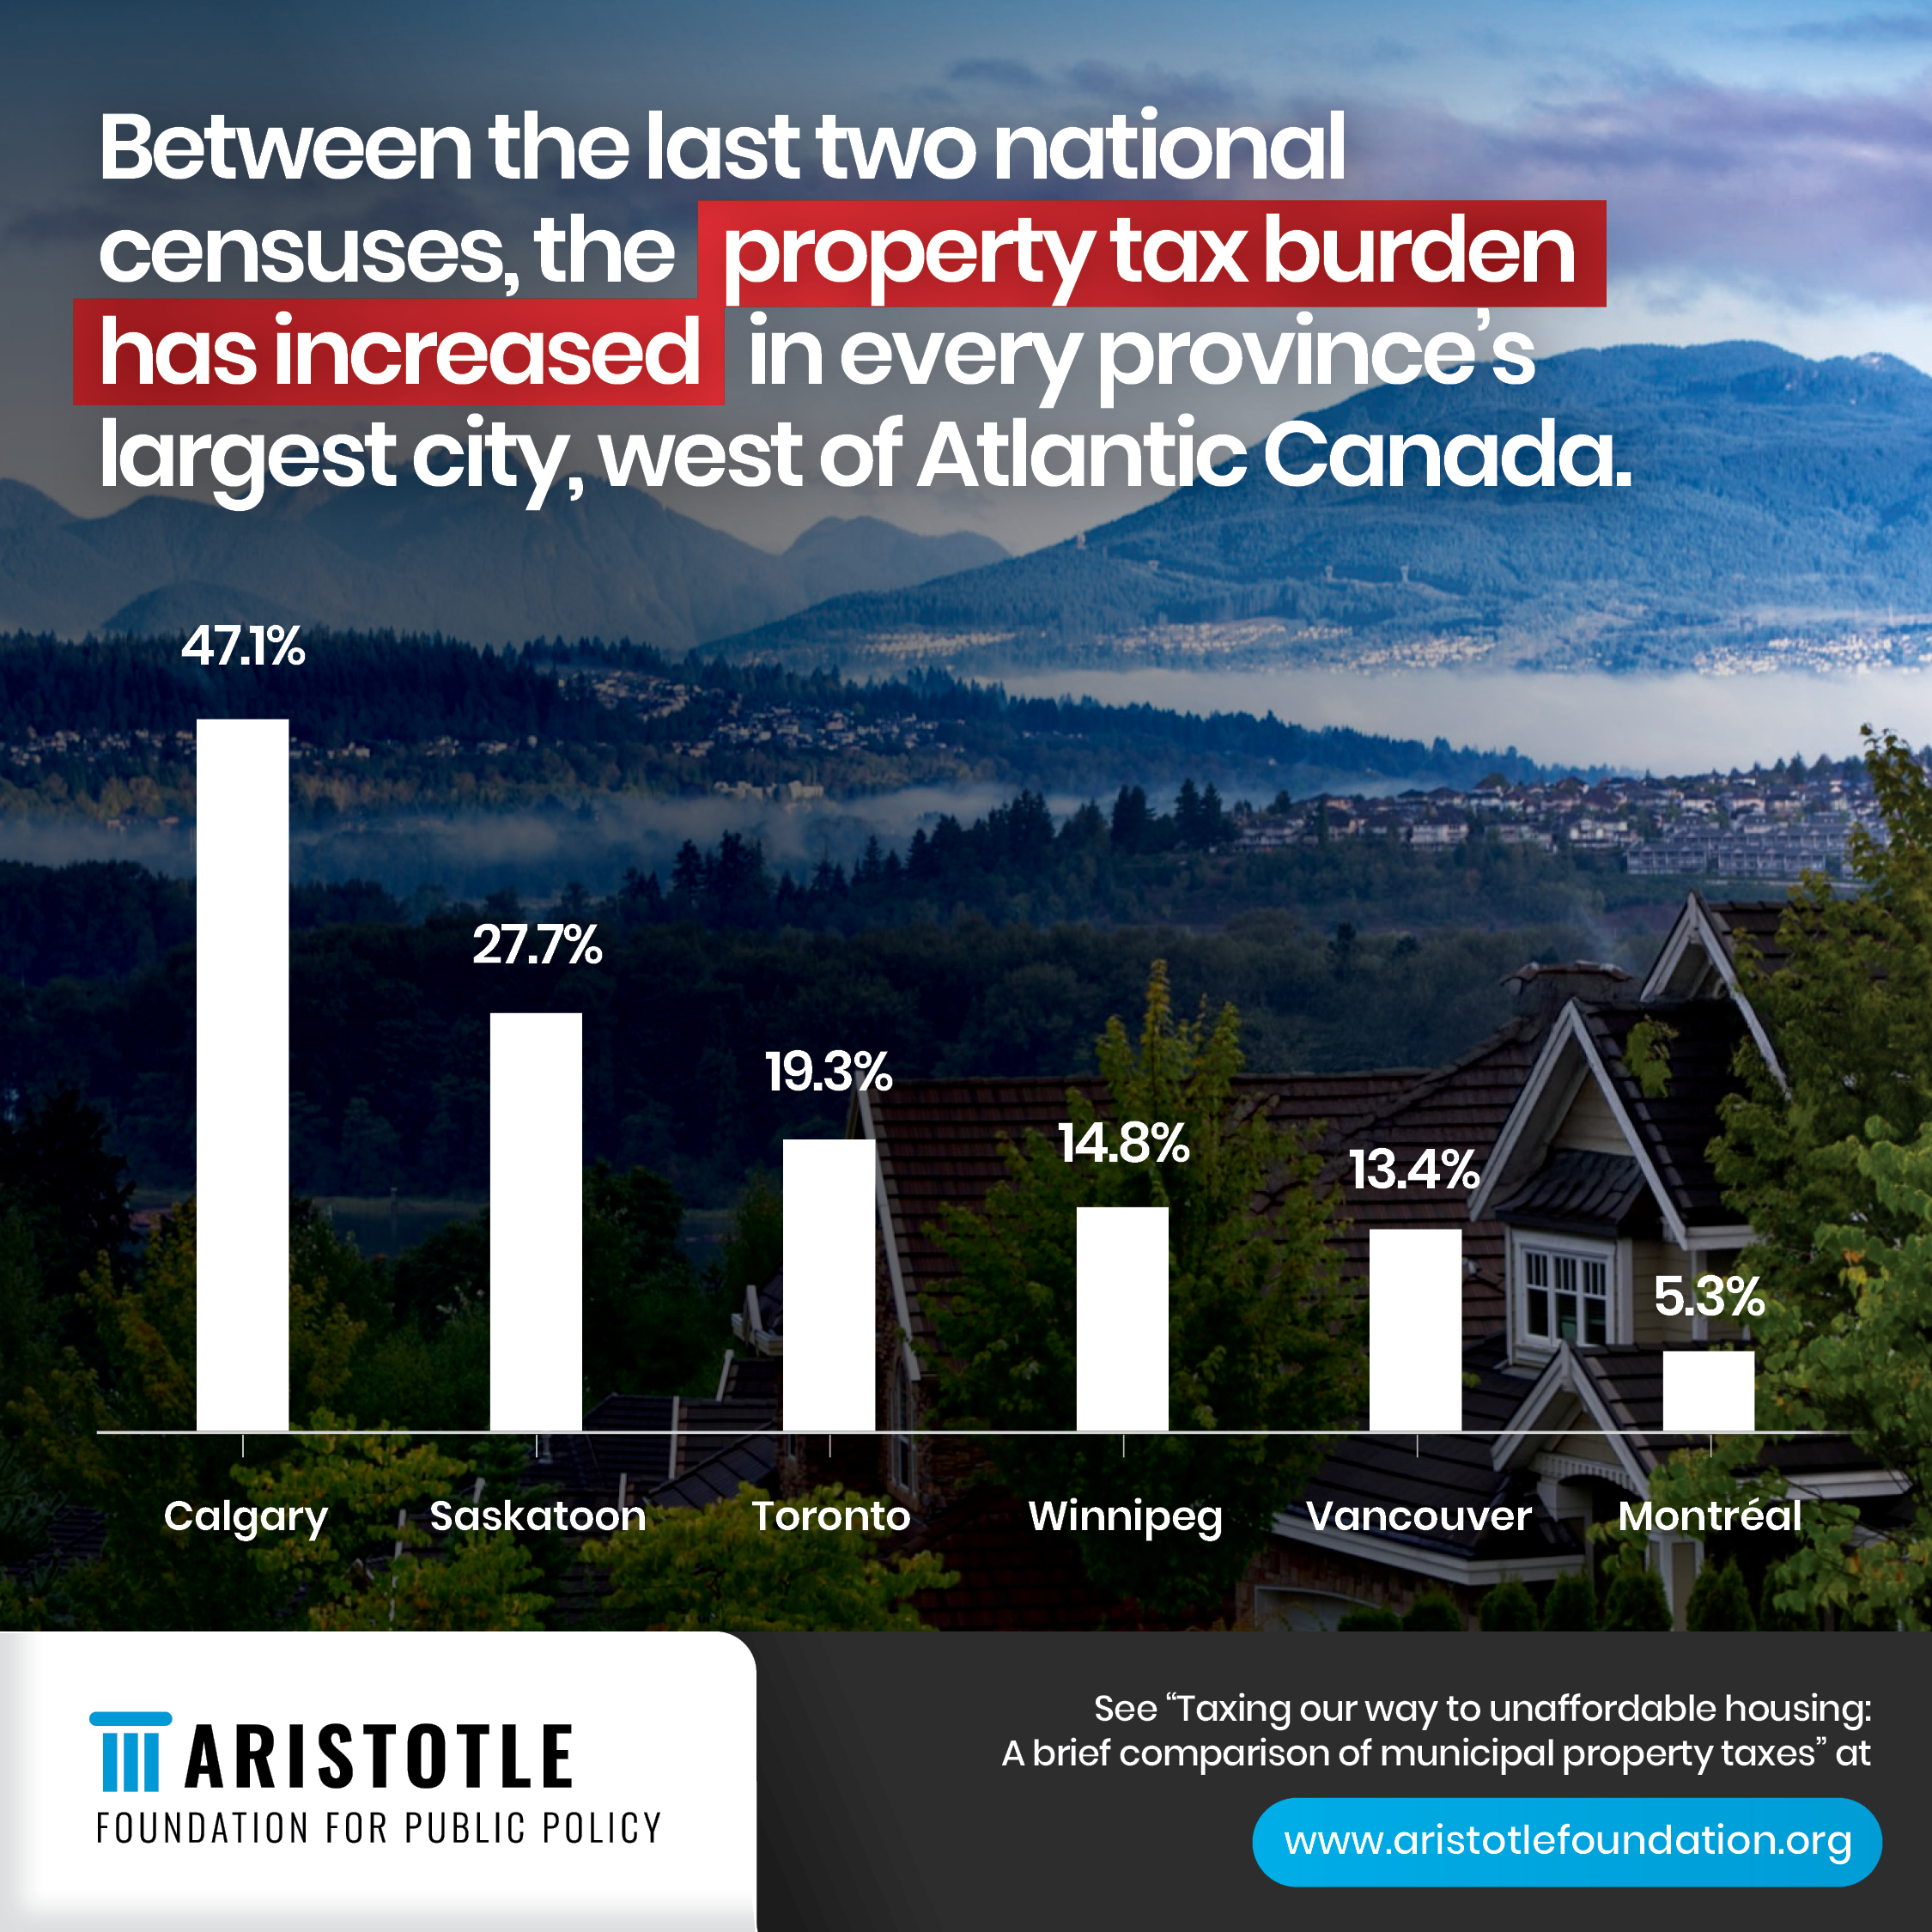
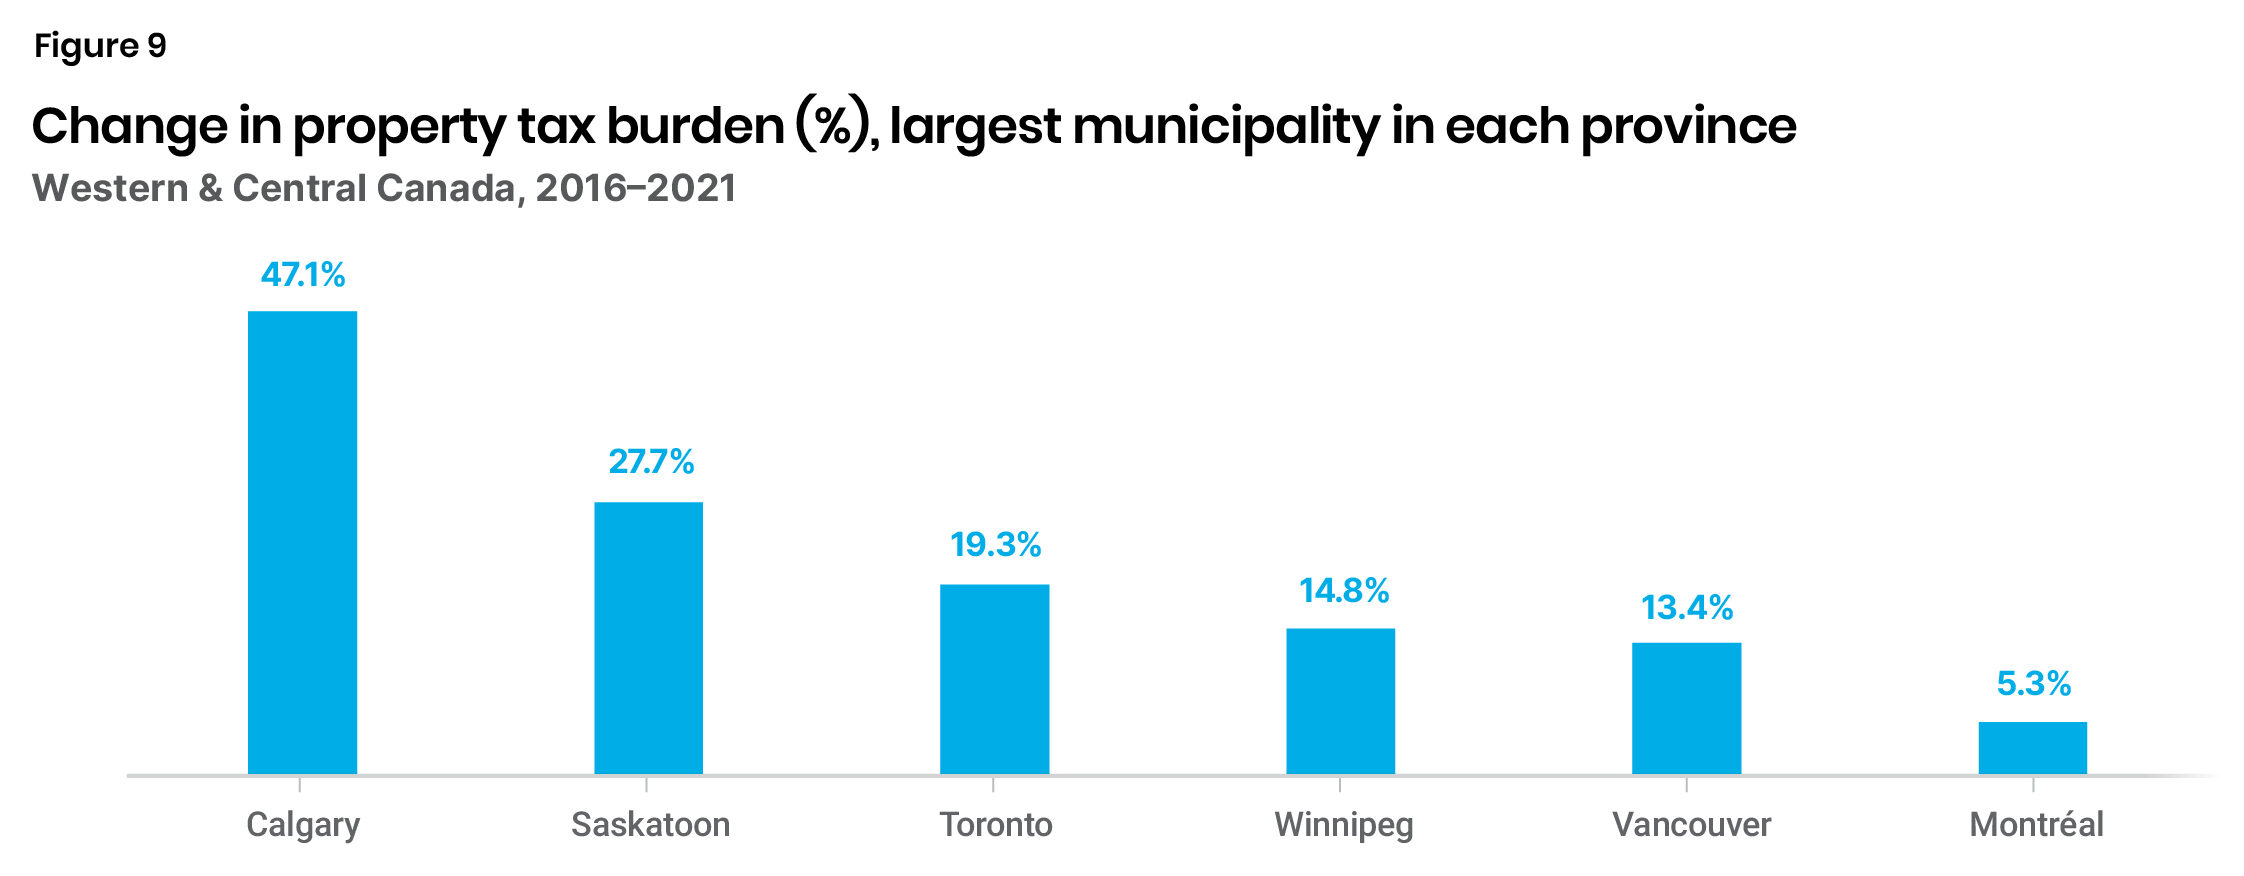
All municipalities in our analysis saw an increase in their property tax burden, ranging from a low of 5 percent to a high of nearly 50 percent. As Calgary’s average household incomes have declined considerably amidst even higher spikes in the nominal and effective property tax rates, Calgary’s overall property tax burden climbed the most—a staggering 47 percent in just five years (Figure 9). For context, Calgary’s overall burden on its homeowners increased almost twice as quickly as second-place Saskatoon and three-and-a-half times faster than Vancouver! By contrast, while Montreal’s property tax burden did rise, it was the lowest—just 5 percent—due to a declining effective property tax rate alongside rising household incomes. (See Table A2 in the Appendix for details.)
Notes:
- Tax burden = property taxes as a percentage of household income in the calendar year.
- Constant Canadian dollars, as of 2020, adjusted for inflation.
Source:
Authors’ calculations, based on Statistics Canada custom tabulations from the “Census of Population 2016 and 2021” data.
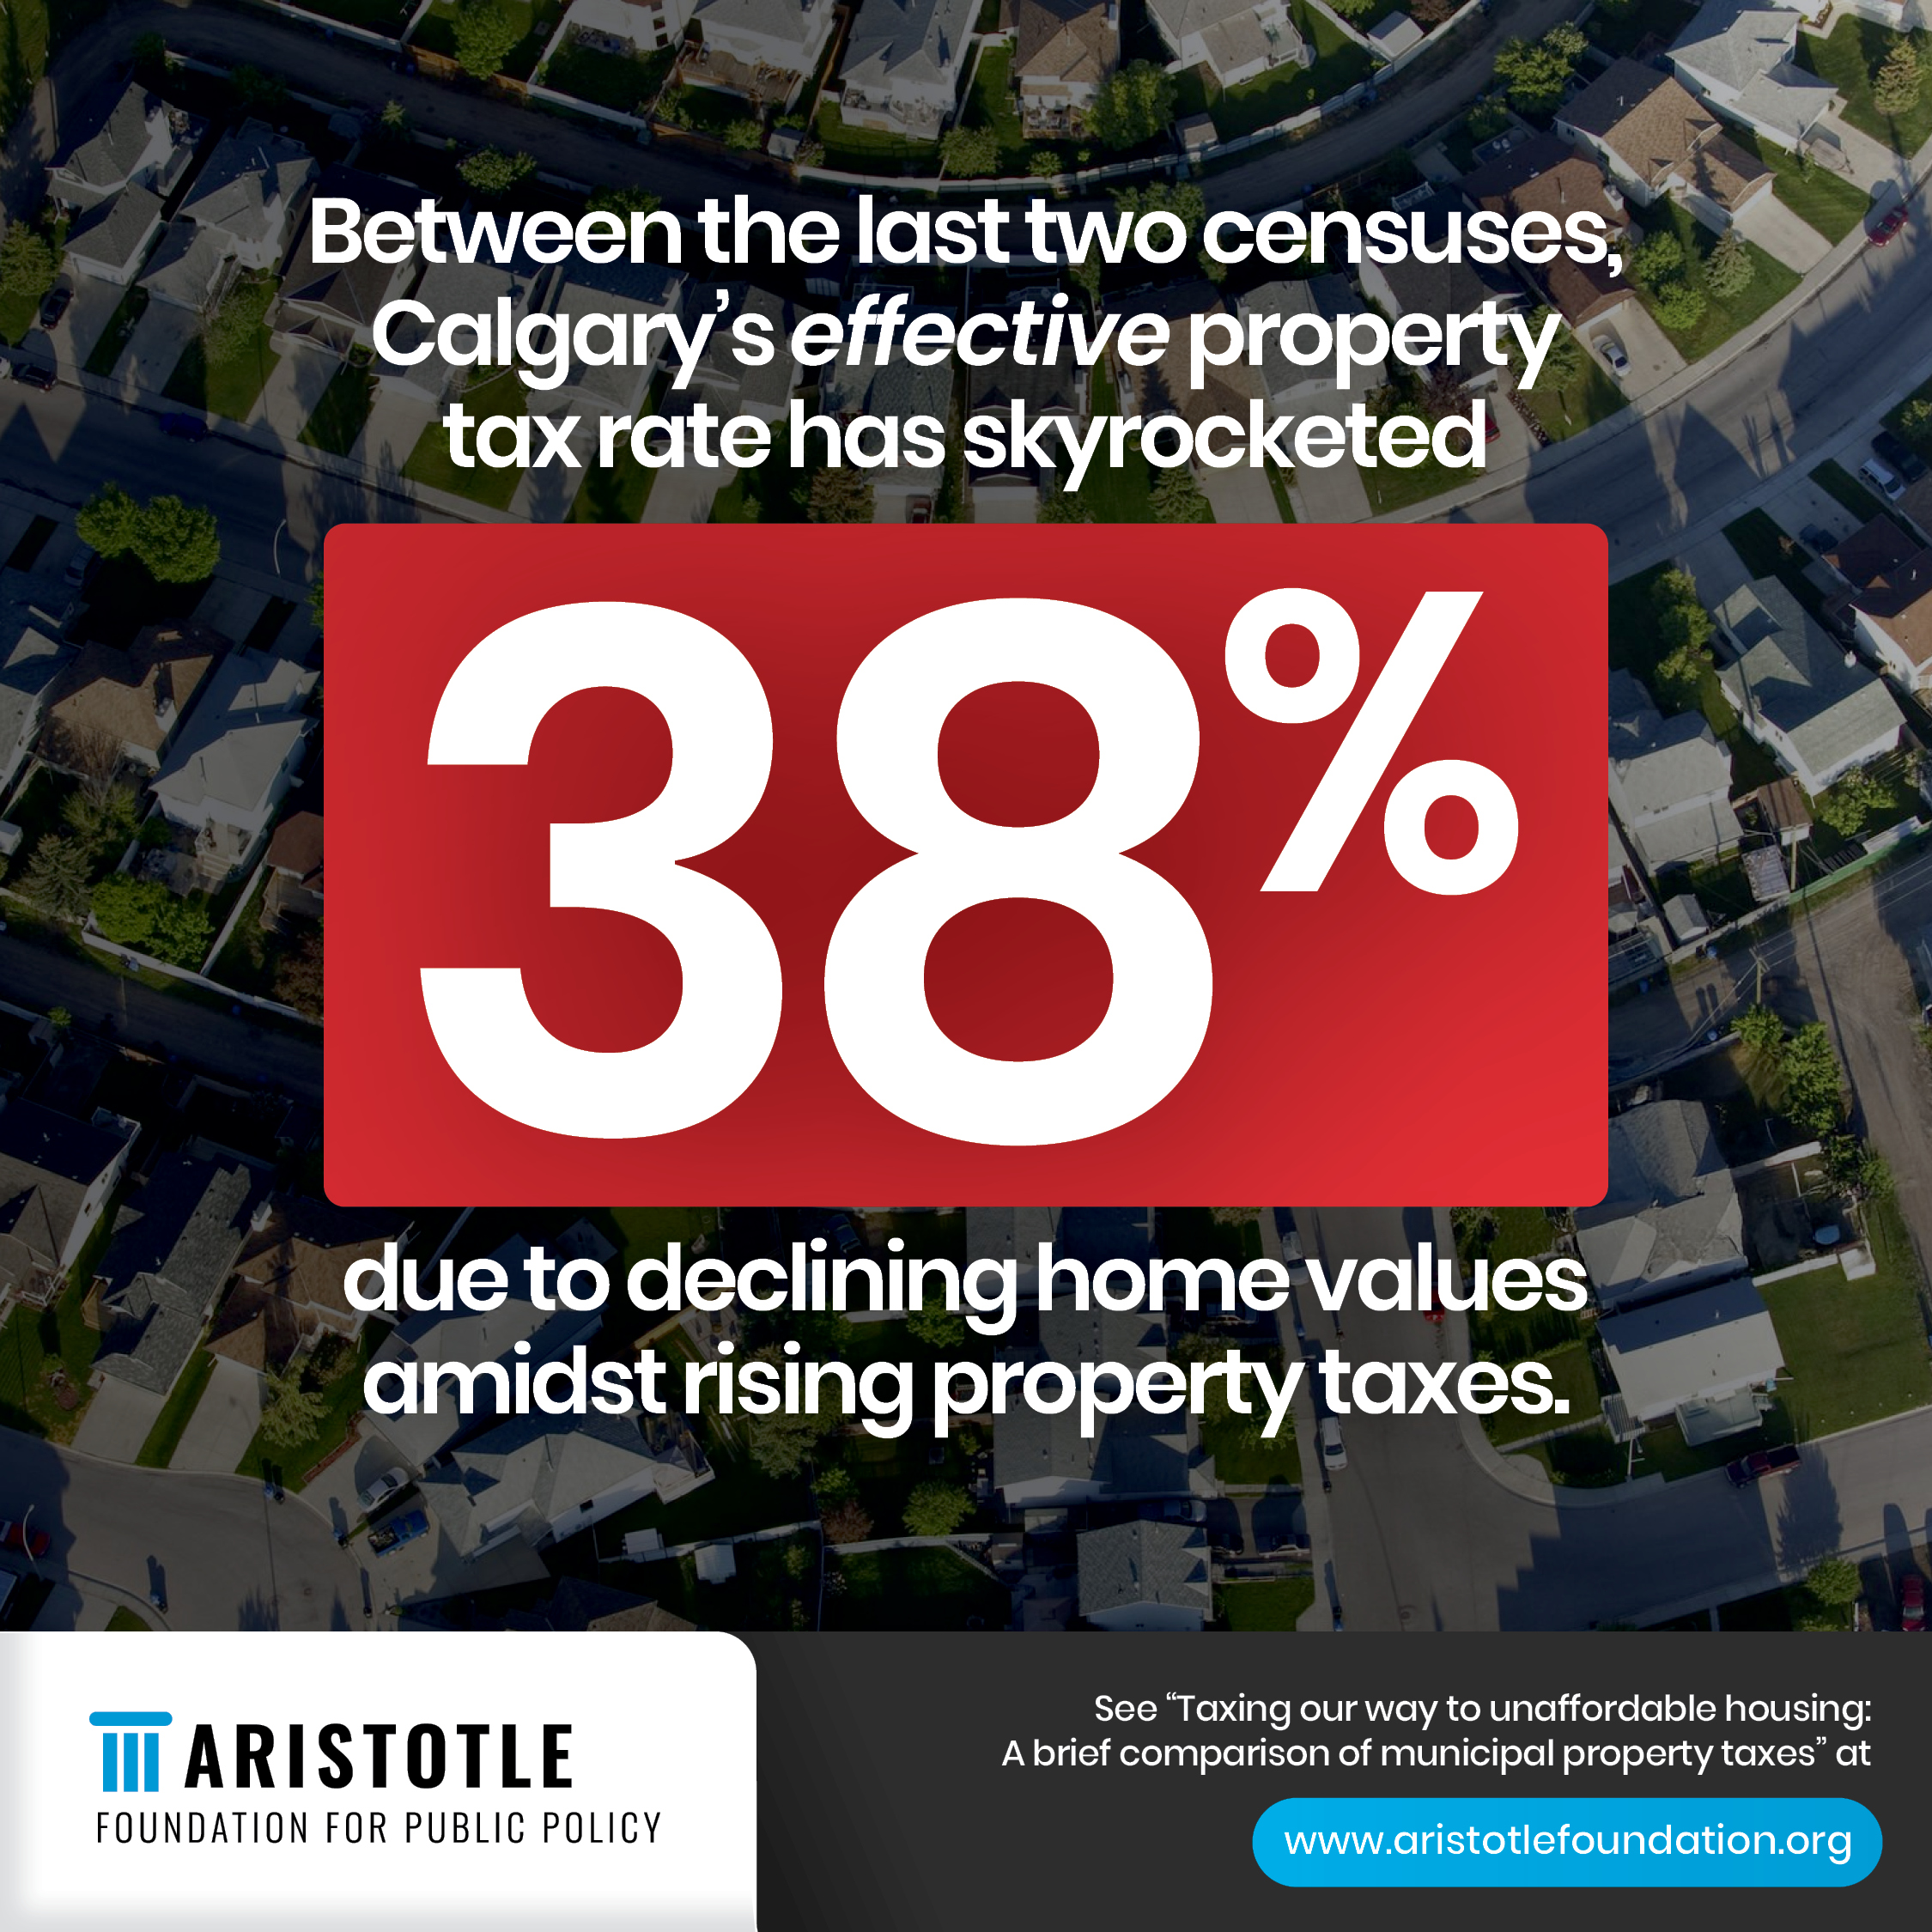
Calgary stands as an outlier, with the most significant increase in both the effective tax rate (38 percent) and property tax burden (47 percent). A decline in income (-13.2 percent) and dwelling value (-7.3 percent) suggests economic strain between the 2016 and 2021 census periods.
Without Calgary, Saskatoon would top the list of concerning trends. Saskatoon also shows considerable economic strain (both falling incomes and falling home values), but high increases in the property tax rate and tax burden. These concerns are not uniform across Western Canada, though, as Winnipeg and Vancouver both show moderate increases across all measures.
Montreal and Toronto show relatively strong economic performance (income and property value growth) over this period. Both Central Canadian cities even boasted reductions in effective property tax rates, resulting in comparatively lower increases in property tax burden. Still, the overall property tax burden did increase, especially in Toronto (19.3 percent).
Notes:
- Effective tax rate = property taxes as a percentage of the estimated market value of the dwelling.
- Tax burden = property taxes as a percentage of household income in the calendar year.
- Constant Canadian dollars, as of 2020, adjusted for inflation
Source:
Authors’ calculations, based on Statistics Canada custom tabulations from 2016 and 2021 Census Canada
These trends matter for at least three reasons. First, property tax is an essential source of revenue for municipalities across Canada. City councils set their property tax rate, and the routine payment made by residential homeowners is the backbone of municipal funding.
Second, housing is the most expensive purchase most Canadians make. The taxes we pay on these purchases are among the largest variables affecting affordability between municipalities. Surprise increases in this burden can place the financial goals of ordinary Canadian families out of their reach. Thus, Canadians naturally take these costs into account when choosing where to live.
And third, municipalities can fall into a vicious spiral, if they are not careful. Falling incomes and residential property values mean municipalities either have to trim their budgets or increase property taxes. The latter is, obviously, the easier decision for the municipality. But rising property tax burdens could lead to the city becoming a less desirable place to live. This could mean weaker residential property values, weaker population growth, and weaker growth in the number of residential properties. The municipality is then again faced with the choice of trimming budgets or raising taxes. And on and on it goes.
Each province’s largest municipality, west of Atlantic Canada, saw their property tax burden increase between the last two national censuses. The effective property tax rate and the overall property tax burden rose most substantially in Calgary and Saskatoon, at 47 percent and 27.7 percent, respectively, from 2016 to 2021, whereas Montreal saw the lowest property tax burden increase of just 5.3 percent. In conclusion, given the challenges of affordability for Canadians across the board, greater fiscal discipline is needed in Canada’s municipalities.
Jeff Park is a visiting fellow with the Aristotle Foundation for Public Policy, past policy advisor to many political campaigns and officeholders, and founder and executive director of the Alberta Parents’ Union.
Ven Venkatachalam, PhD, CPA, is a senior economist at the Aristotle Foundation for Public Policy. With expertise in economic and fiscal policy, international relations, trade, energy, governance, education, immigration, tourism, and NGO matters, Venkatachalam has consulted for governments, NGOs, and private sector organizations across Asia, Europe, Canada, and the United States.
David Hunt, MPP, BBA, is the research director at the Aristotle Foundation for Public Policy. Hunt has authored and/or directed dozens of peer-reviewed research projects. His work has been presented at numerous conferences and to various levels of government, cited in major media, and used as evidence in court.
The authors would like to publicly thank Pio Tran for his research assistance on this project.
Who we are
The Aristotle Foundation for Public Policy is a new education and public policy think tank that aims to renew a civil, common-sense approach to public discourse and public policy in Canada.
Our vision
A Canada where the sacrifices and successes of past generations are cherished and built upon; where citizens value each other for their character and merit; and where open inquiry and free expression are prized as the best path to a flourishing future for all.
Our mission
We champion reason, democracy, and civilization so that all can participate in a free, flourishing Canada.
Our theory of change: Canada’s idea culture is critical
Ideas—what people believe—come first in any change for ill or good. We will challenge ideas and policies where in error and buttress ideas anchored in reality and excellence.
Donations
The Aristotle Foundation for Public Policy is a registered Canadian charity, and all donations will receive a tax receipt. To maintain our independence, we do not seek nor will we accept government funding. Donations can be made at www.aristotlefoundation.org.
The Aristotle Foundation for Public Policy has internal policies to ensure research is empirical, scholarly, ethical, rigorous, honest, and contributes to the advancement of knowledge and the creation, application, and refinement of knowledge about public policy. Our staff, research fellows, and scholars develop their research in collaboration with the Aristotle Foundation’s staff and research director. Fact sheets, studies, and indices are all peer-reviewed. Subject to critical peer review, authors are responsible for their work and conclusions. The conclusions and views of scholars do not necessarily reflect those of the Board of Directors, donors, or staff.
Image credits: iStock