


In December 2021, Canada’s prime minister handed out 38 mandate letters to each of his federal cabinet ministers. Each one included a statement about “profound systemic inequities and disparities that remain present in the core fabric of our society, including our core institutions.”1
This same sentiment was incorporated in the federal government’s 2019-2022 “anti-racism strategy,” which claimed that “even today there are people and communities who experience systemic racism and discrimination. Racialized communities and Indigenous peoples continue to face systemic barriers, notably in employment, justice, and social participation.”2
Likewise, the Department of National Defence claims “white supremacy was first woven into the fabric of Canadian society with the colonization of Indigenous lands by European settlers,” and since then, “government and institutional policies have exercised discriminatory control over the citizenship rights of Indigenous People, racialized people, religious minorities and LGBTQ2+ communities.”3
This Reality Check answers two questions. First, is there evidence to back up claims such as these that Canada today is systemically racist? And second, are government programs and strategies likely to reduce the incidence or mitigate the effects of racism in society? The answer to both is a resounding “no.”
Thomas Sowell observes that “much of what is said in the name of ‘social justice’ implicitly assumes… the seemingly invincible fallacy that various groups would be equally successful in the absence of biased treatment by others.”4 The fallacy, in other words, is that in the absence of racism, sexism, and other forms of discrimination, all people groups (races, sexes, and so on) would achieve similar outcomes.
Sowell has written whole books debunking this fallacy, but a single comparison of the life expectancy of men and women in Canada will suffice to show that discrimination does not explain all, or even most of the disparities of outcomes between individuals or groups: The life expectancy of females born in 1921 exceeded males by 1.8 years, and this disparity rose steadily every decade to reach 7.1 years in 1981. The trend then reversed, shrinking to 4.3 years in 2019, the last year with available data (Figure 1).5
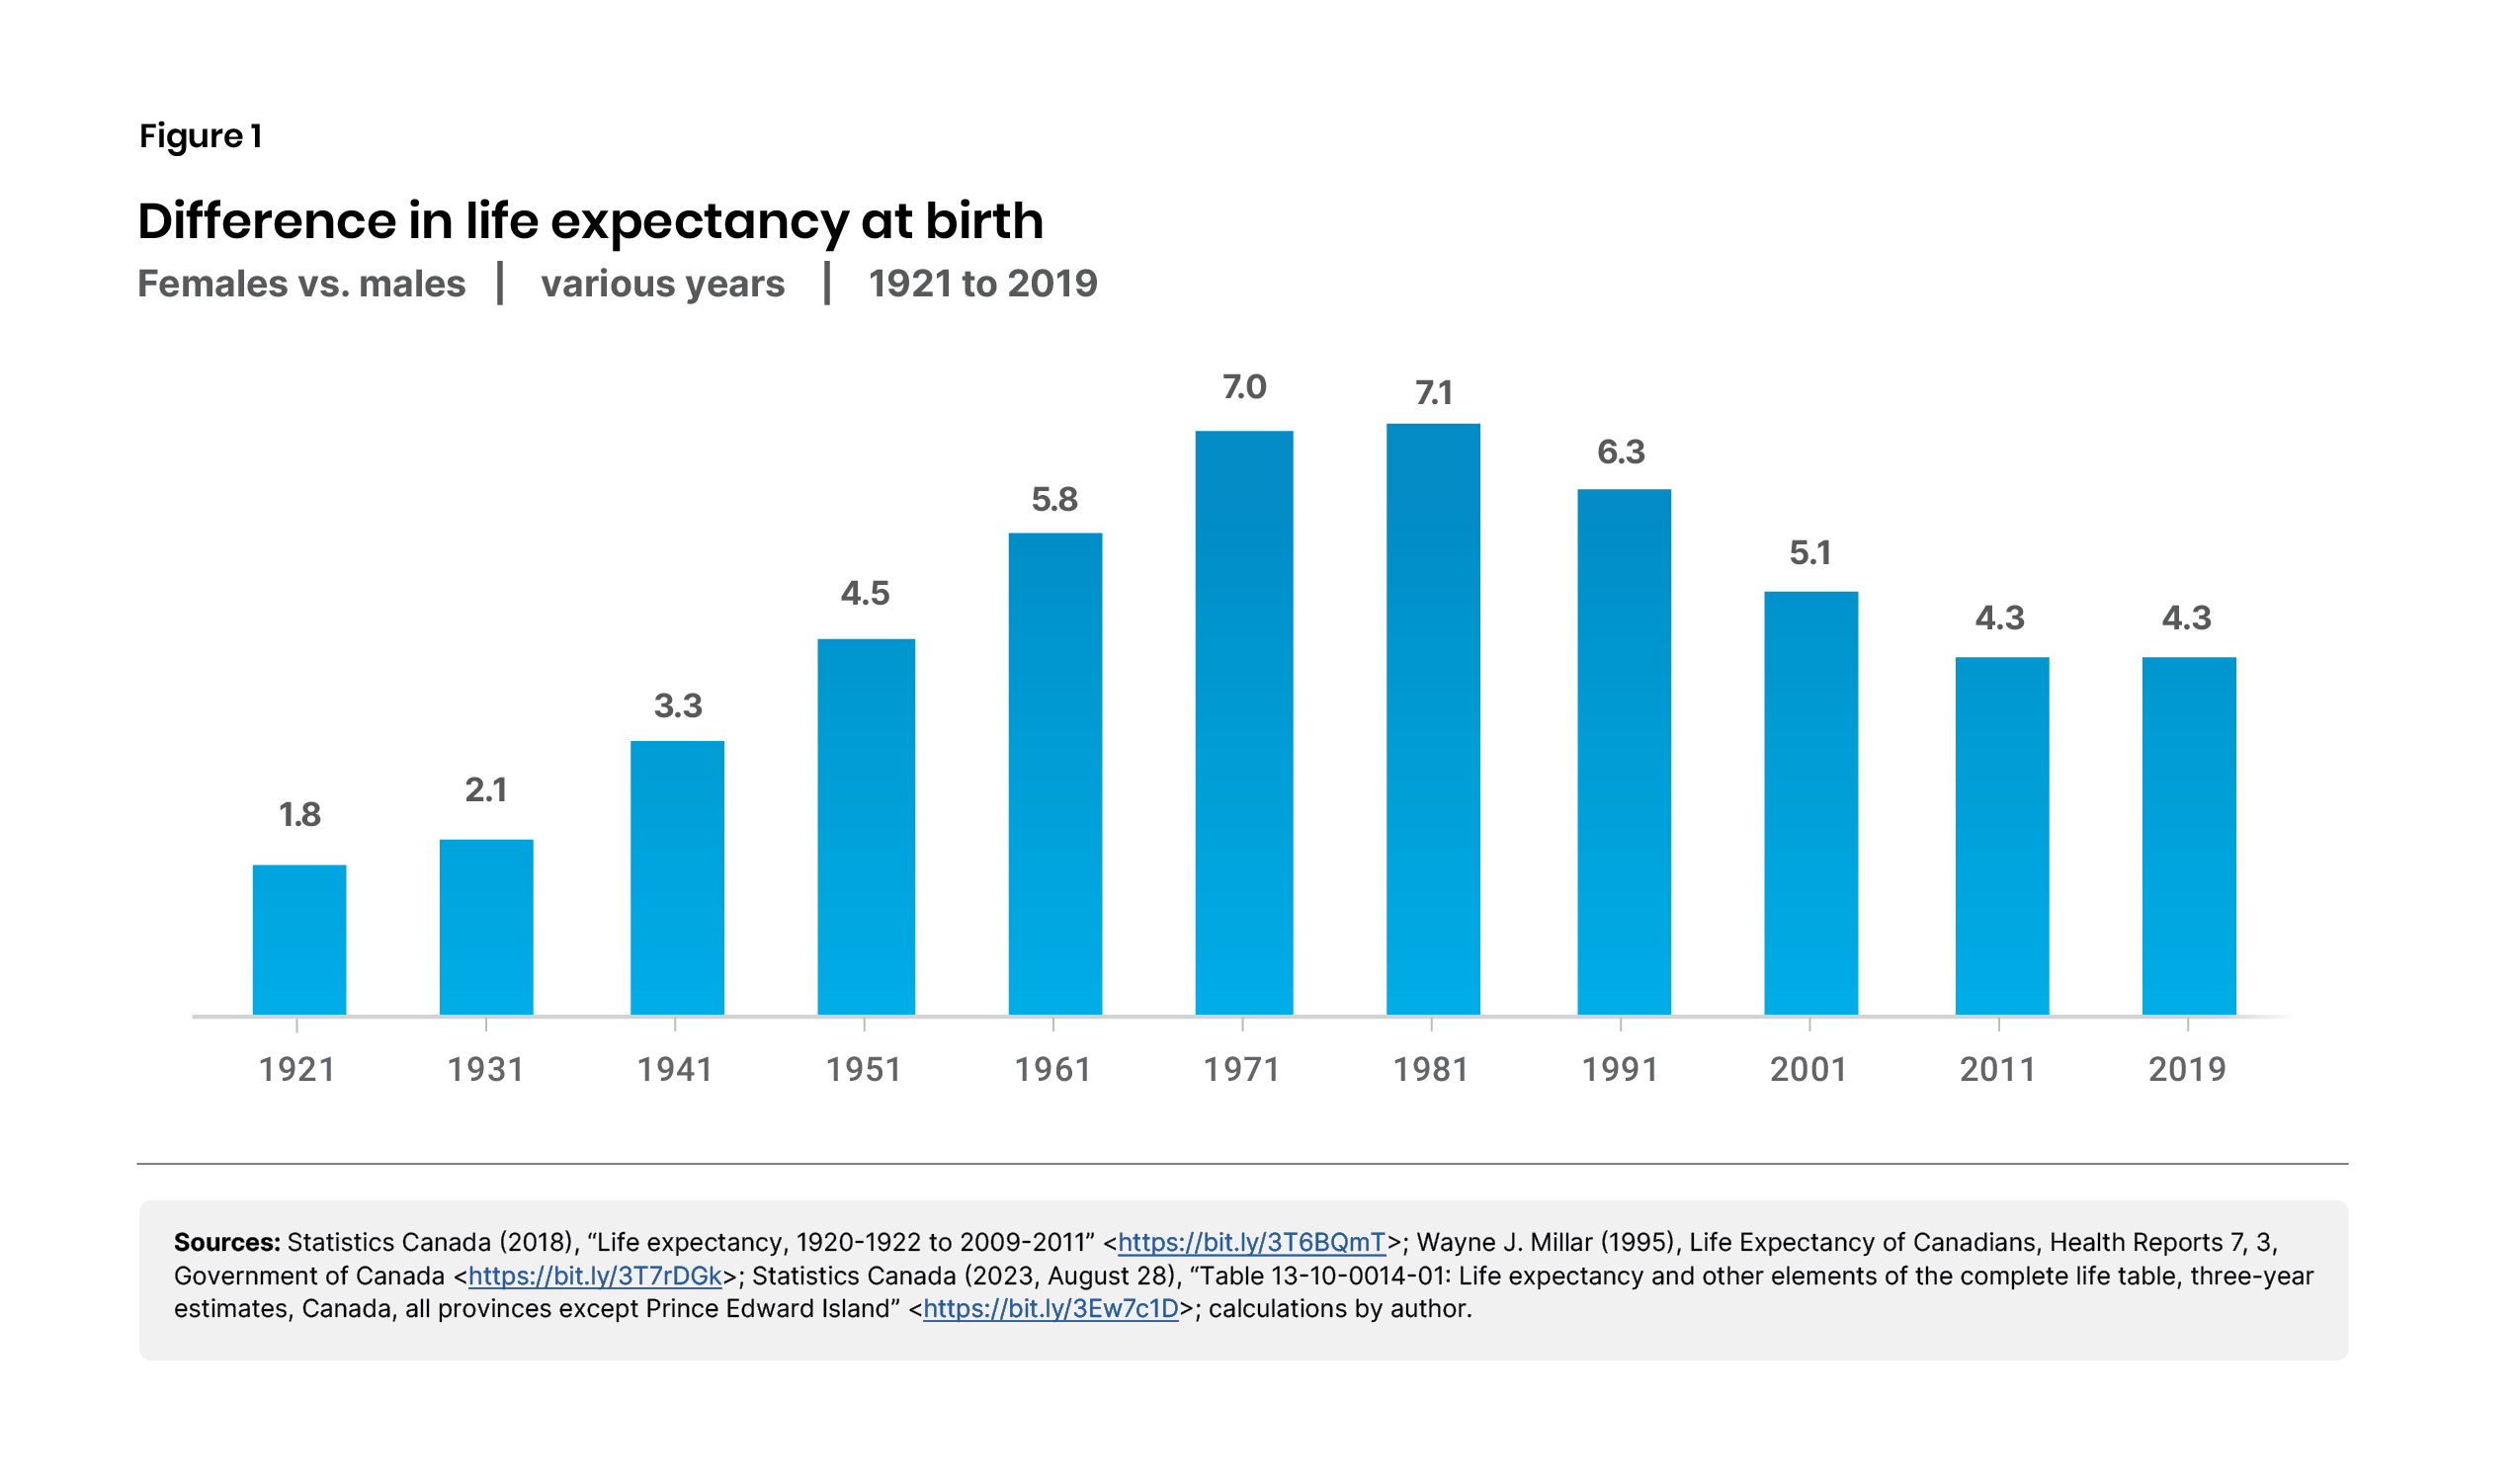
One interpretation of Figure 1 is that Canadian society has for the past century discriminated against men – increasingly more viciously from 1921 to 1981 – before abating somewhat in the last four decades. But if we are not ready to conclude that, we similarly should hesitate to conclude automatically that disparate outcomes between races is attributable to discrimination. It is worth looking at the statistics to see what disparities exist and whether discrimination can explain them.
Contrary to the narrative that racial minorities in Canada suffer widespread disadvantage, a Statistics Canada analysis of the weekly earnings of Canadian-born individuals based on 2016 Census data found many visible minority groups out-earn the white population (Figures 2 and 3). This is true for both men and women.6
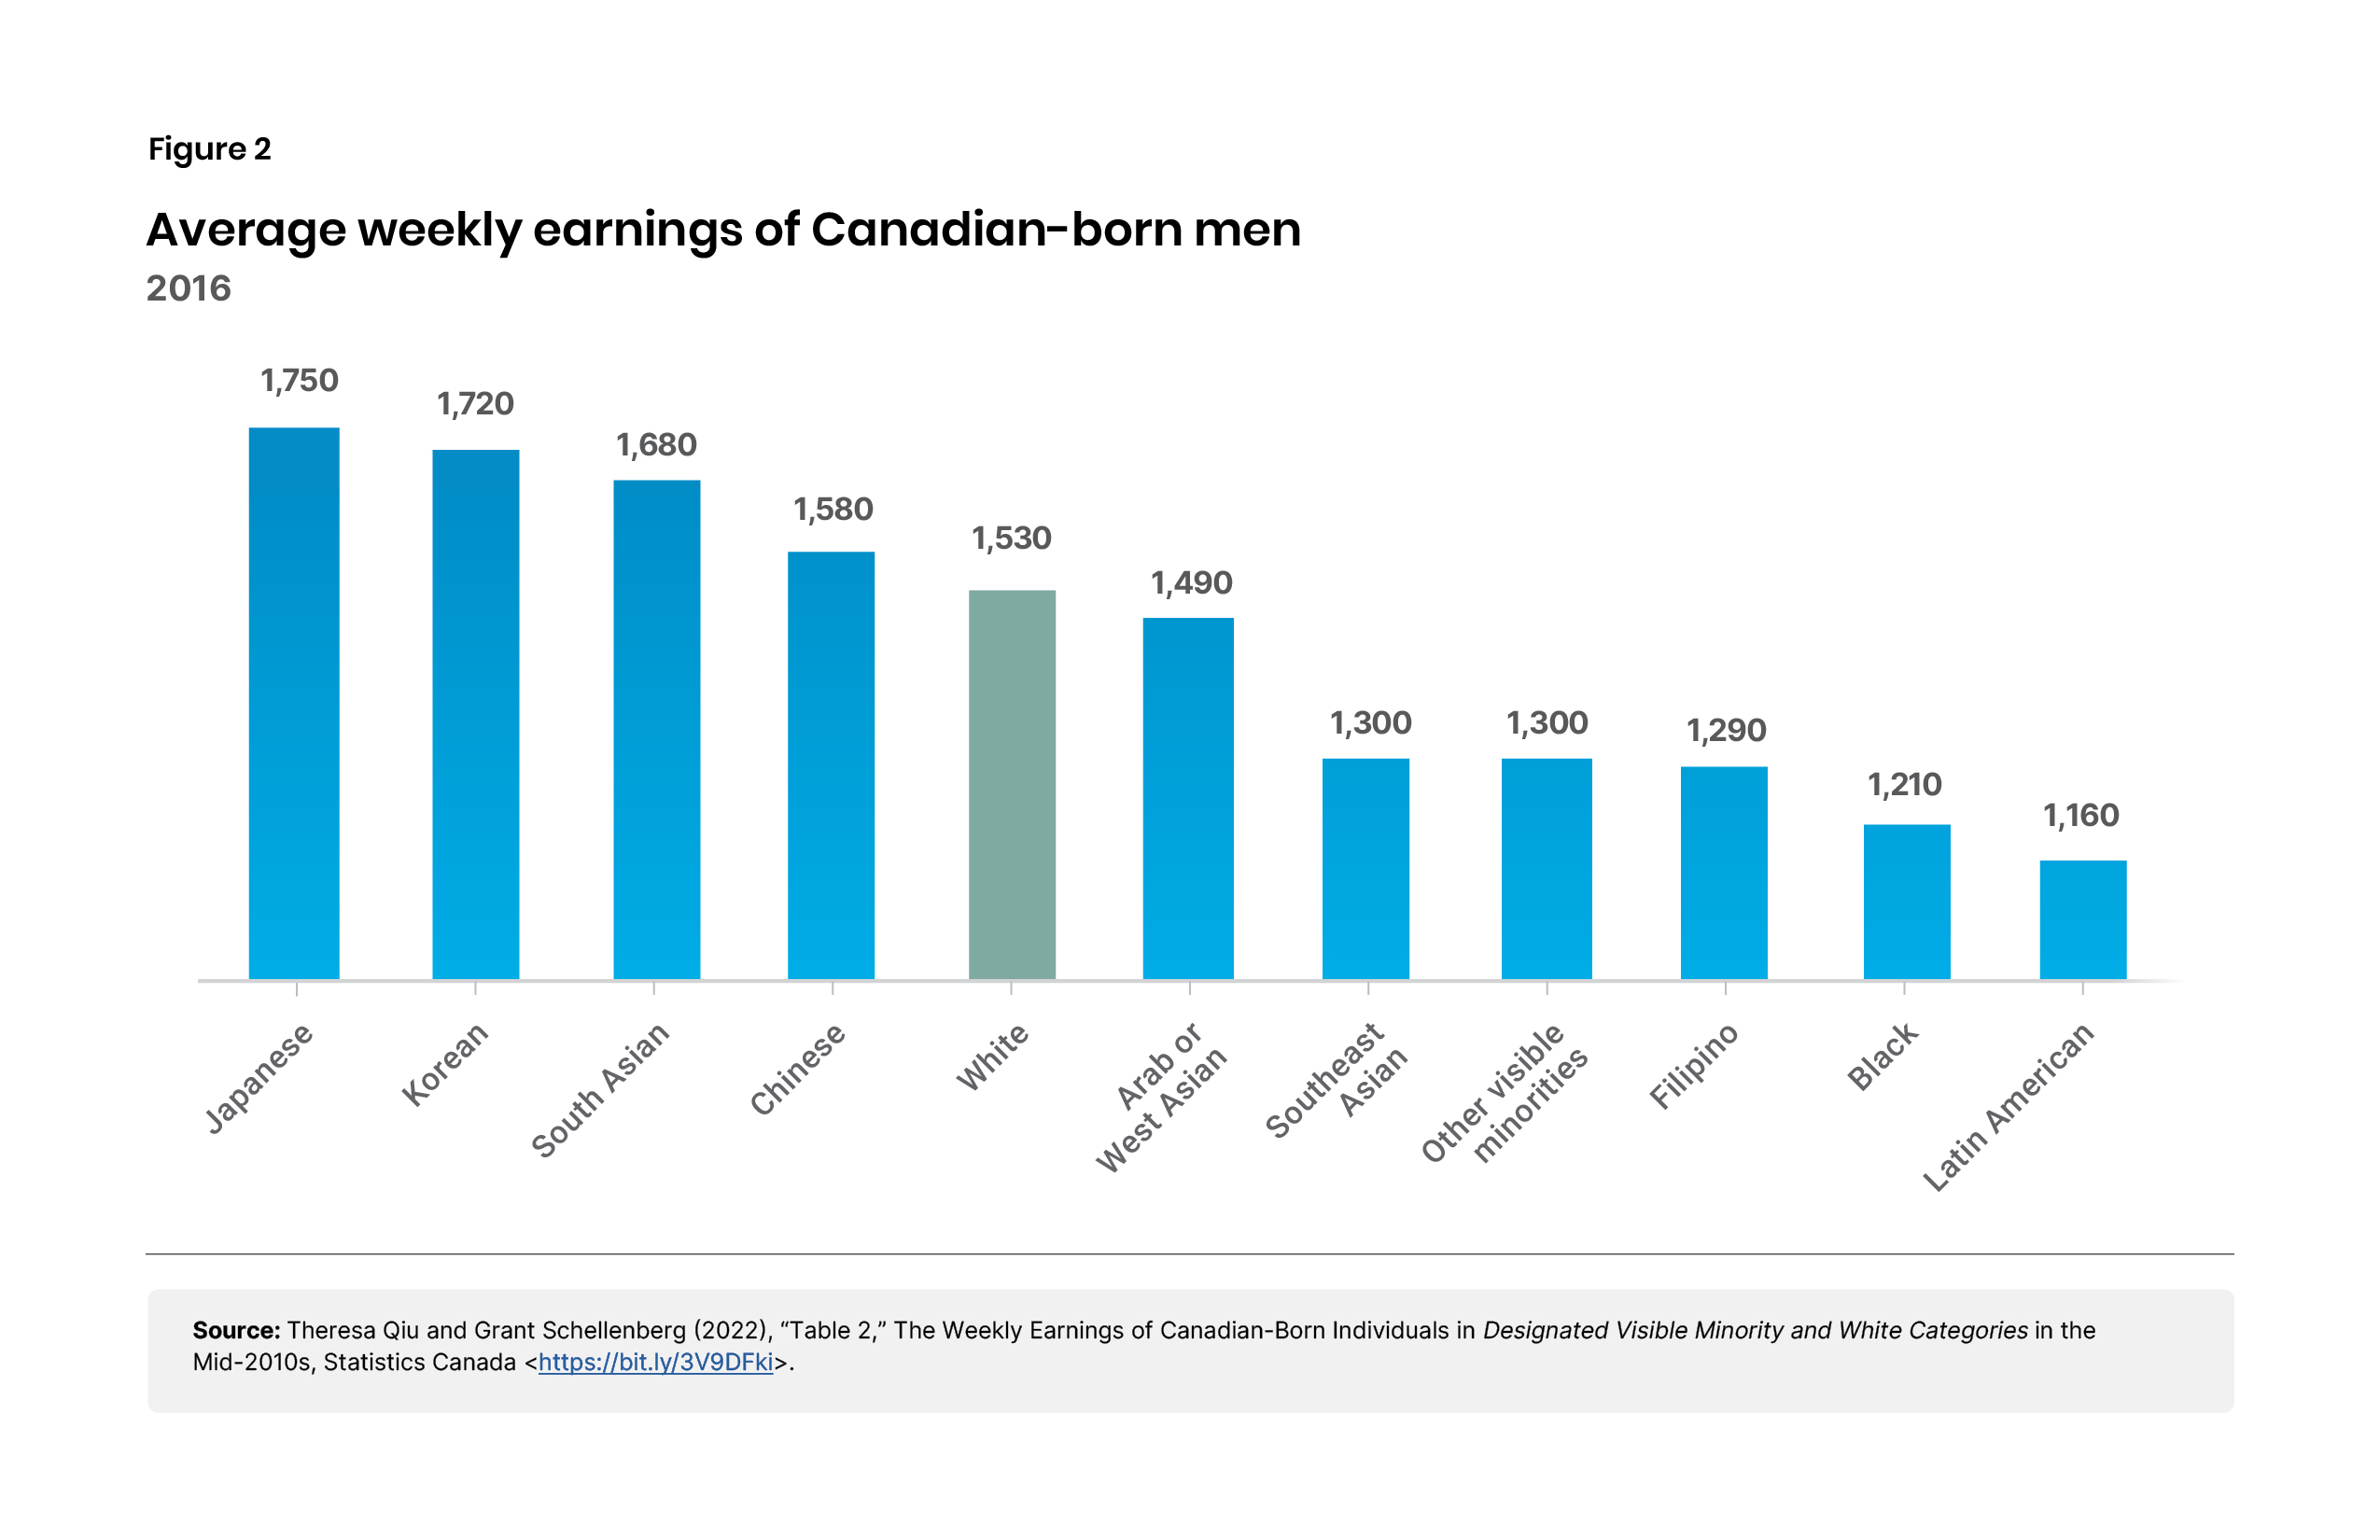
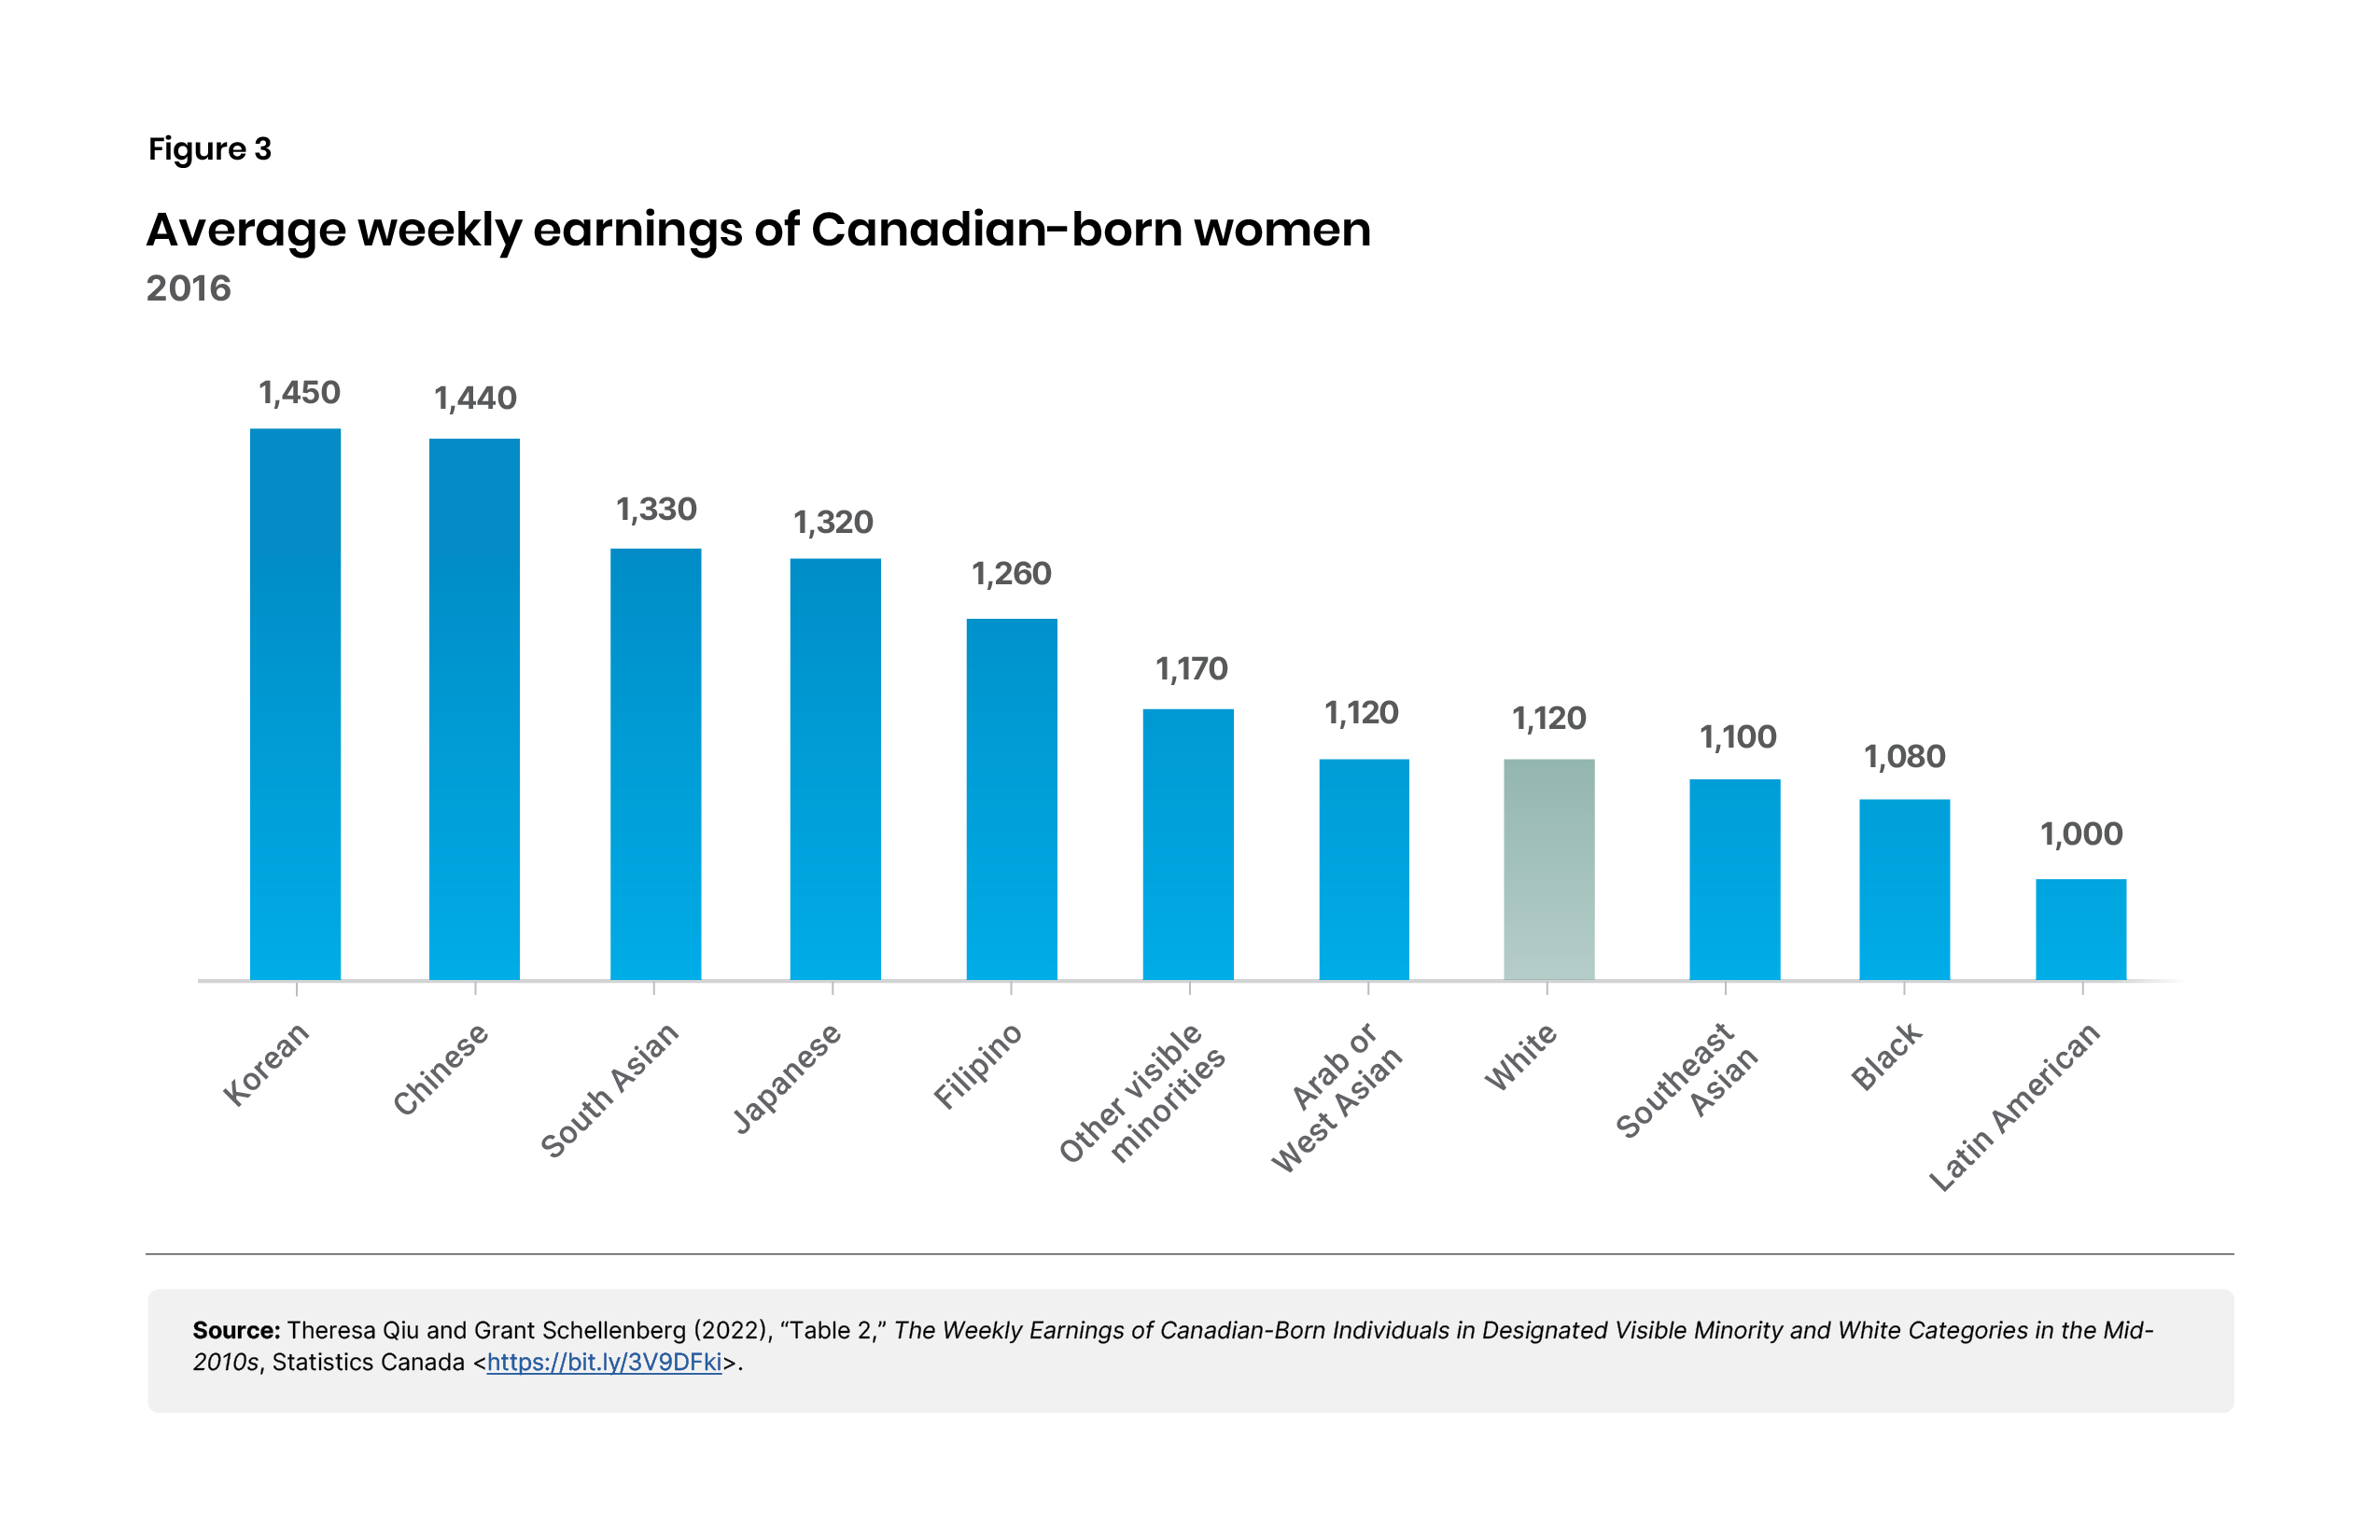
The raw data show the white cohort around the middle of the pack. Importantly, the accompanying Statistics Canada report attempts to produce an apples-to-apples comparison by controlling for education, occupation, and other factors that affect earnings. Its report again segments the minority population into 10 racial groups and the 2 sexes, yielding 20 minority groups that can be compared against their white counterparts.
The report found that of the 20 minority groups:
Thus, whether looking at the raw data or the apples-to-apples comparisons, Statistics Canada finds the white cohort had higher earnings than some minority groups and lower earnings than others. The theory that Canadian institutions are rigged to benefit the white population and disfavour visible minorities therefore finds little support in the income statistics.
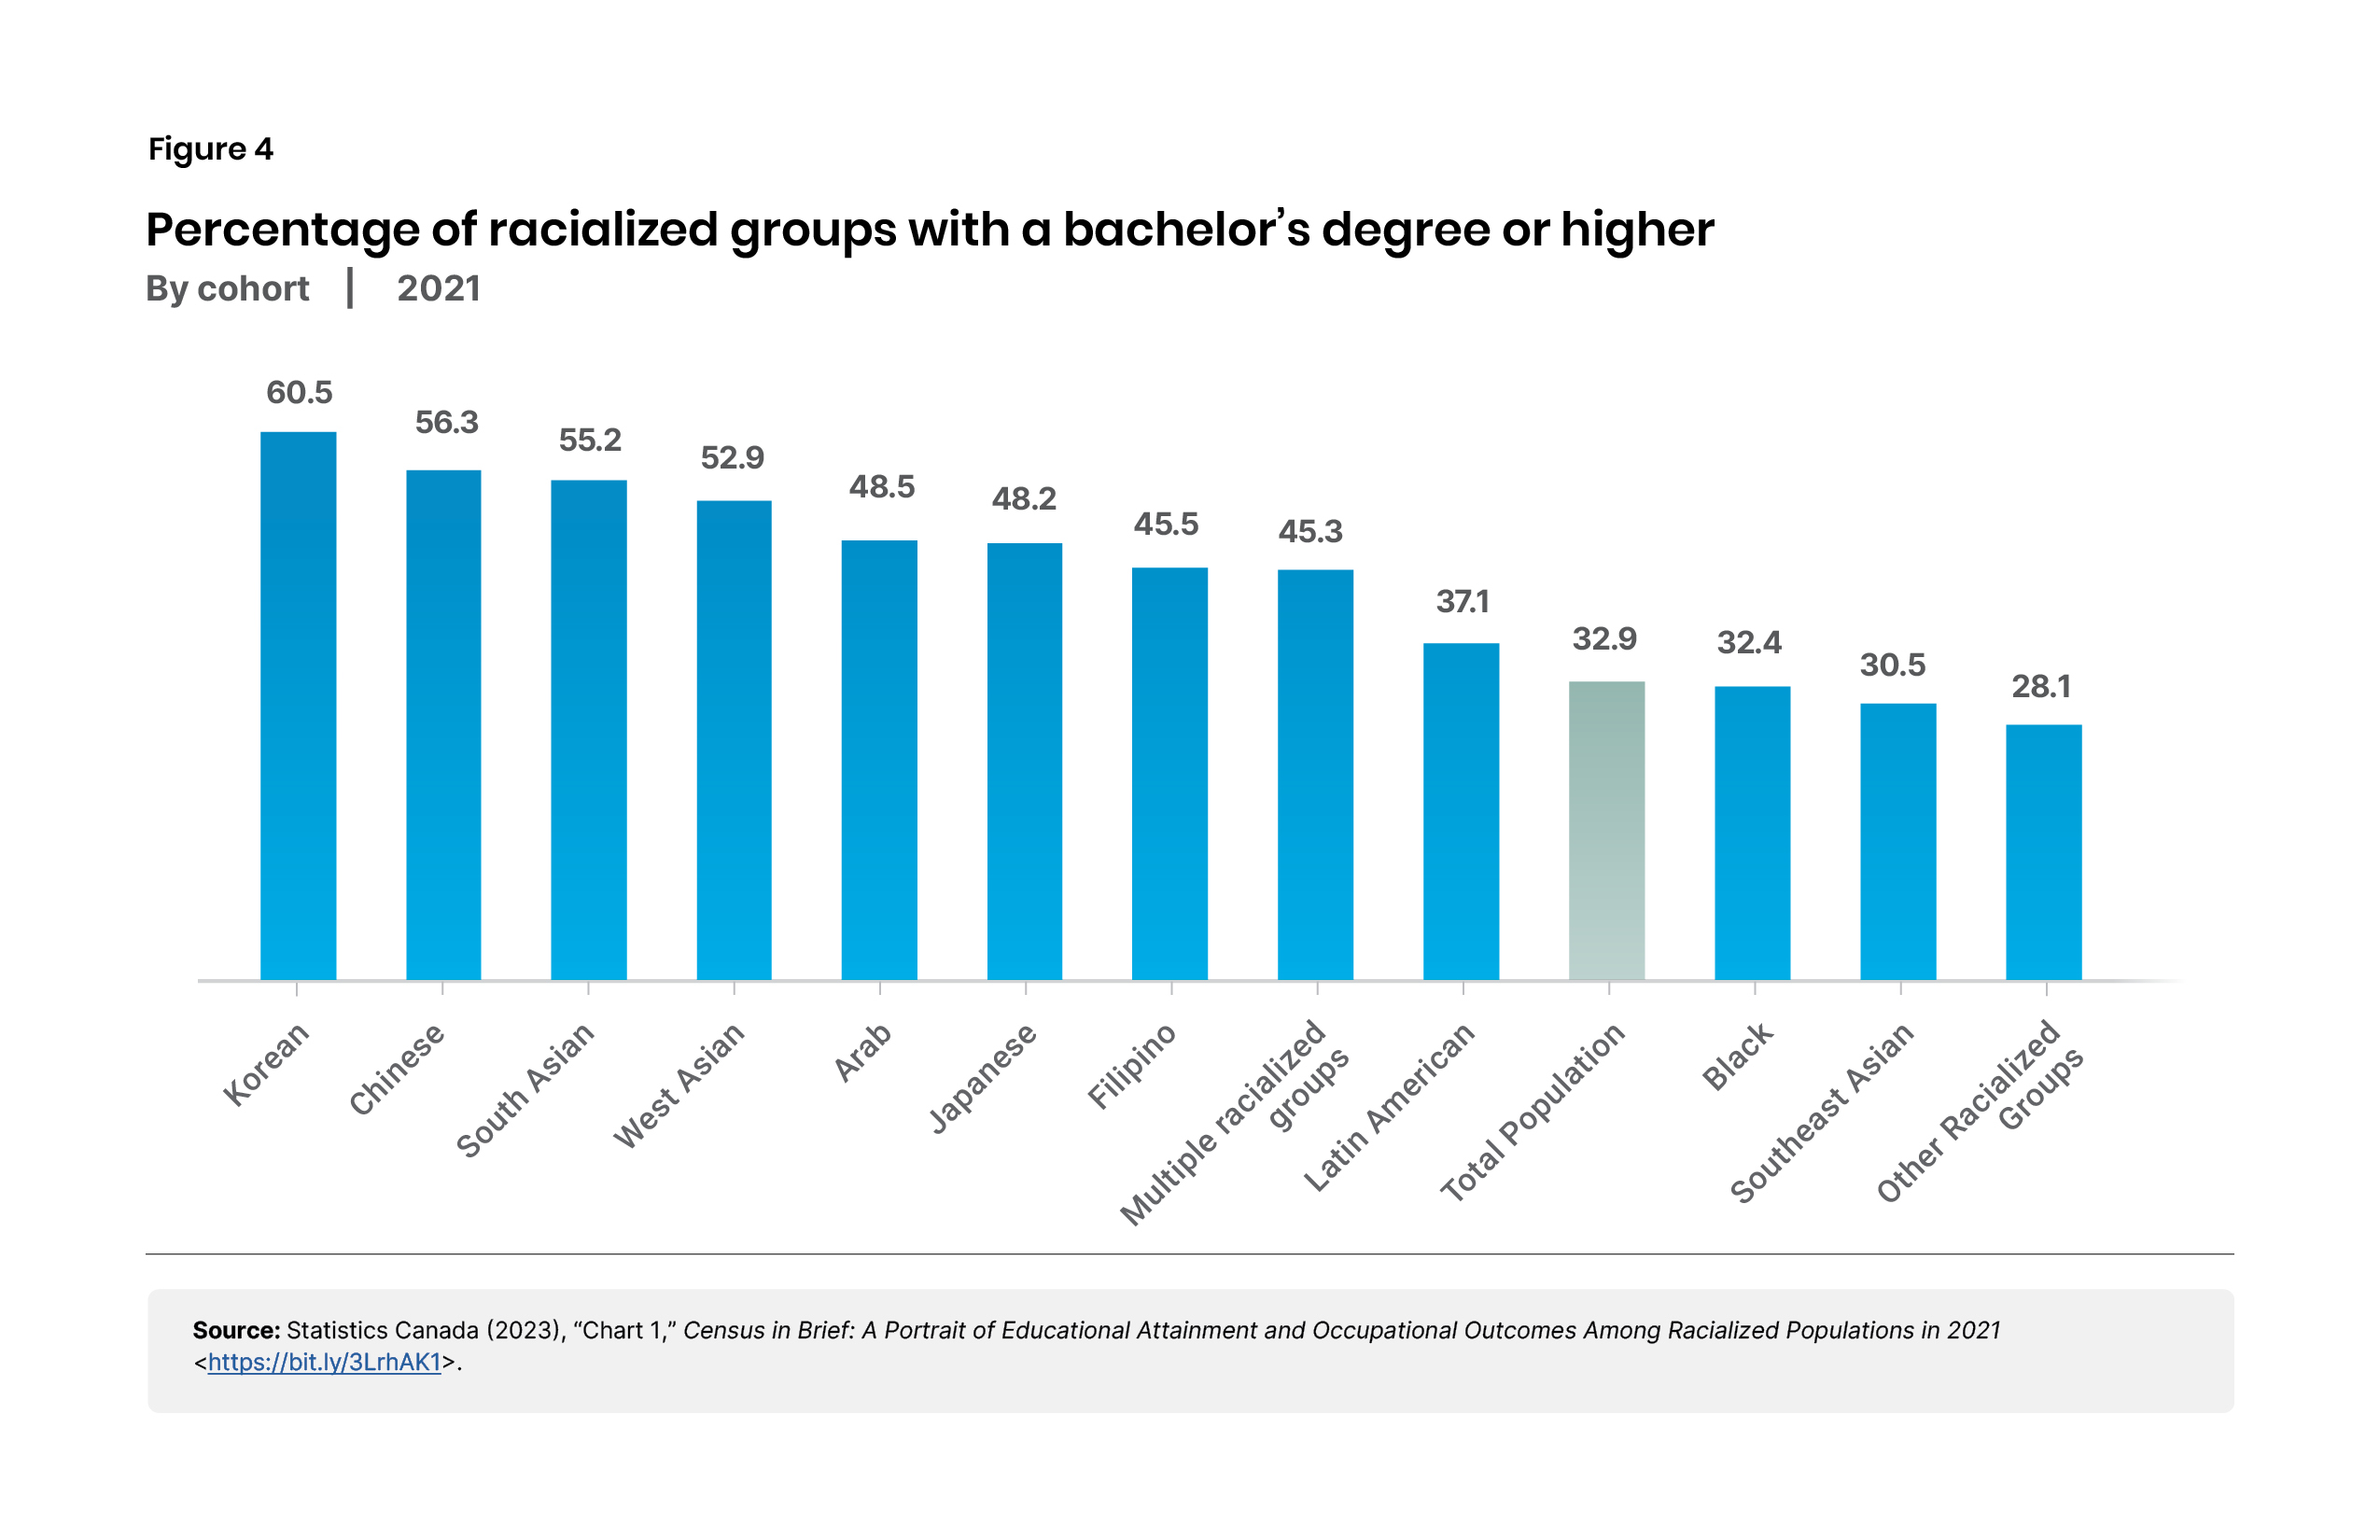
Just as many visible minority groups have higher earnings than the white population, so too do many minority groups achieve higher levels of education – again, not what one would expect if Canadian institutions put visible minorities at a disadvantage.
In fact, Statistics Canada reports based on the 2021 Census that “many Asian populations attained a bachelor’s degree or higher at rates that were well above the national average of 32.9 percent (Figure 4). Over half of the Korean, Chinese, South Asian and West Asian populations and over 40 percent of the Arab, Japanese and Filipino populations had a bachelor’s degree or higher.”8
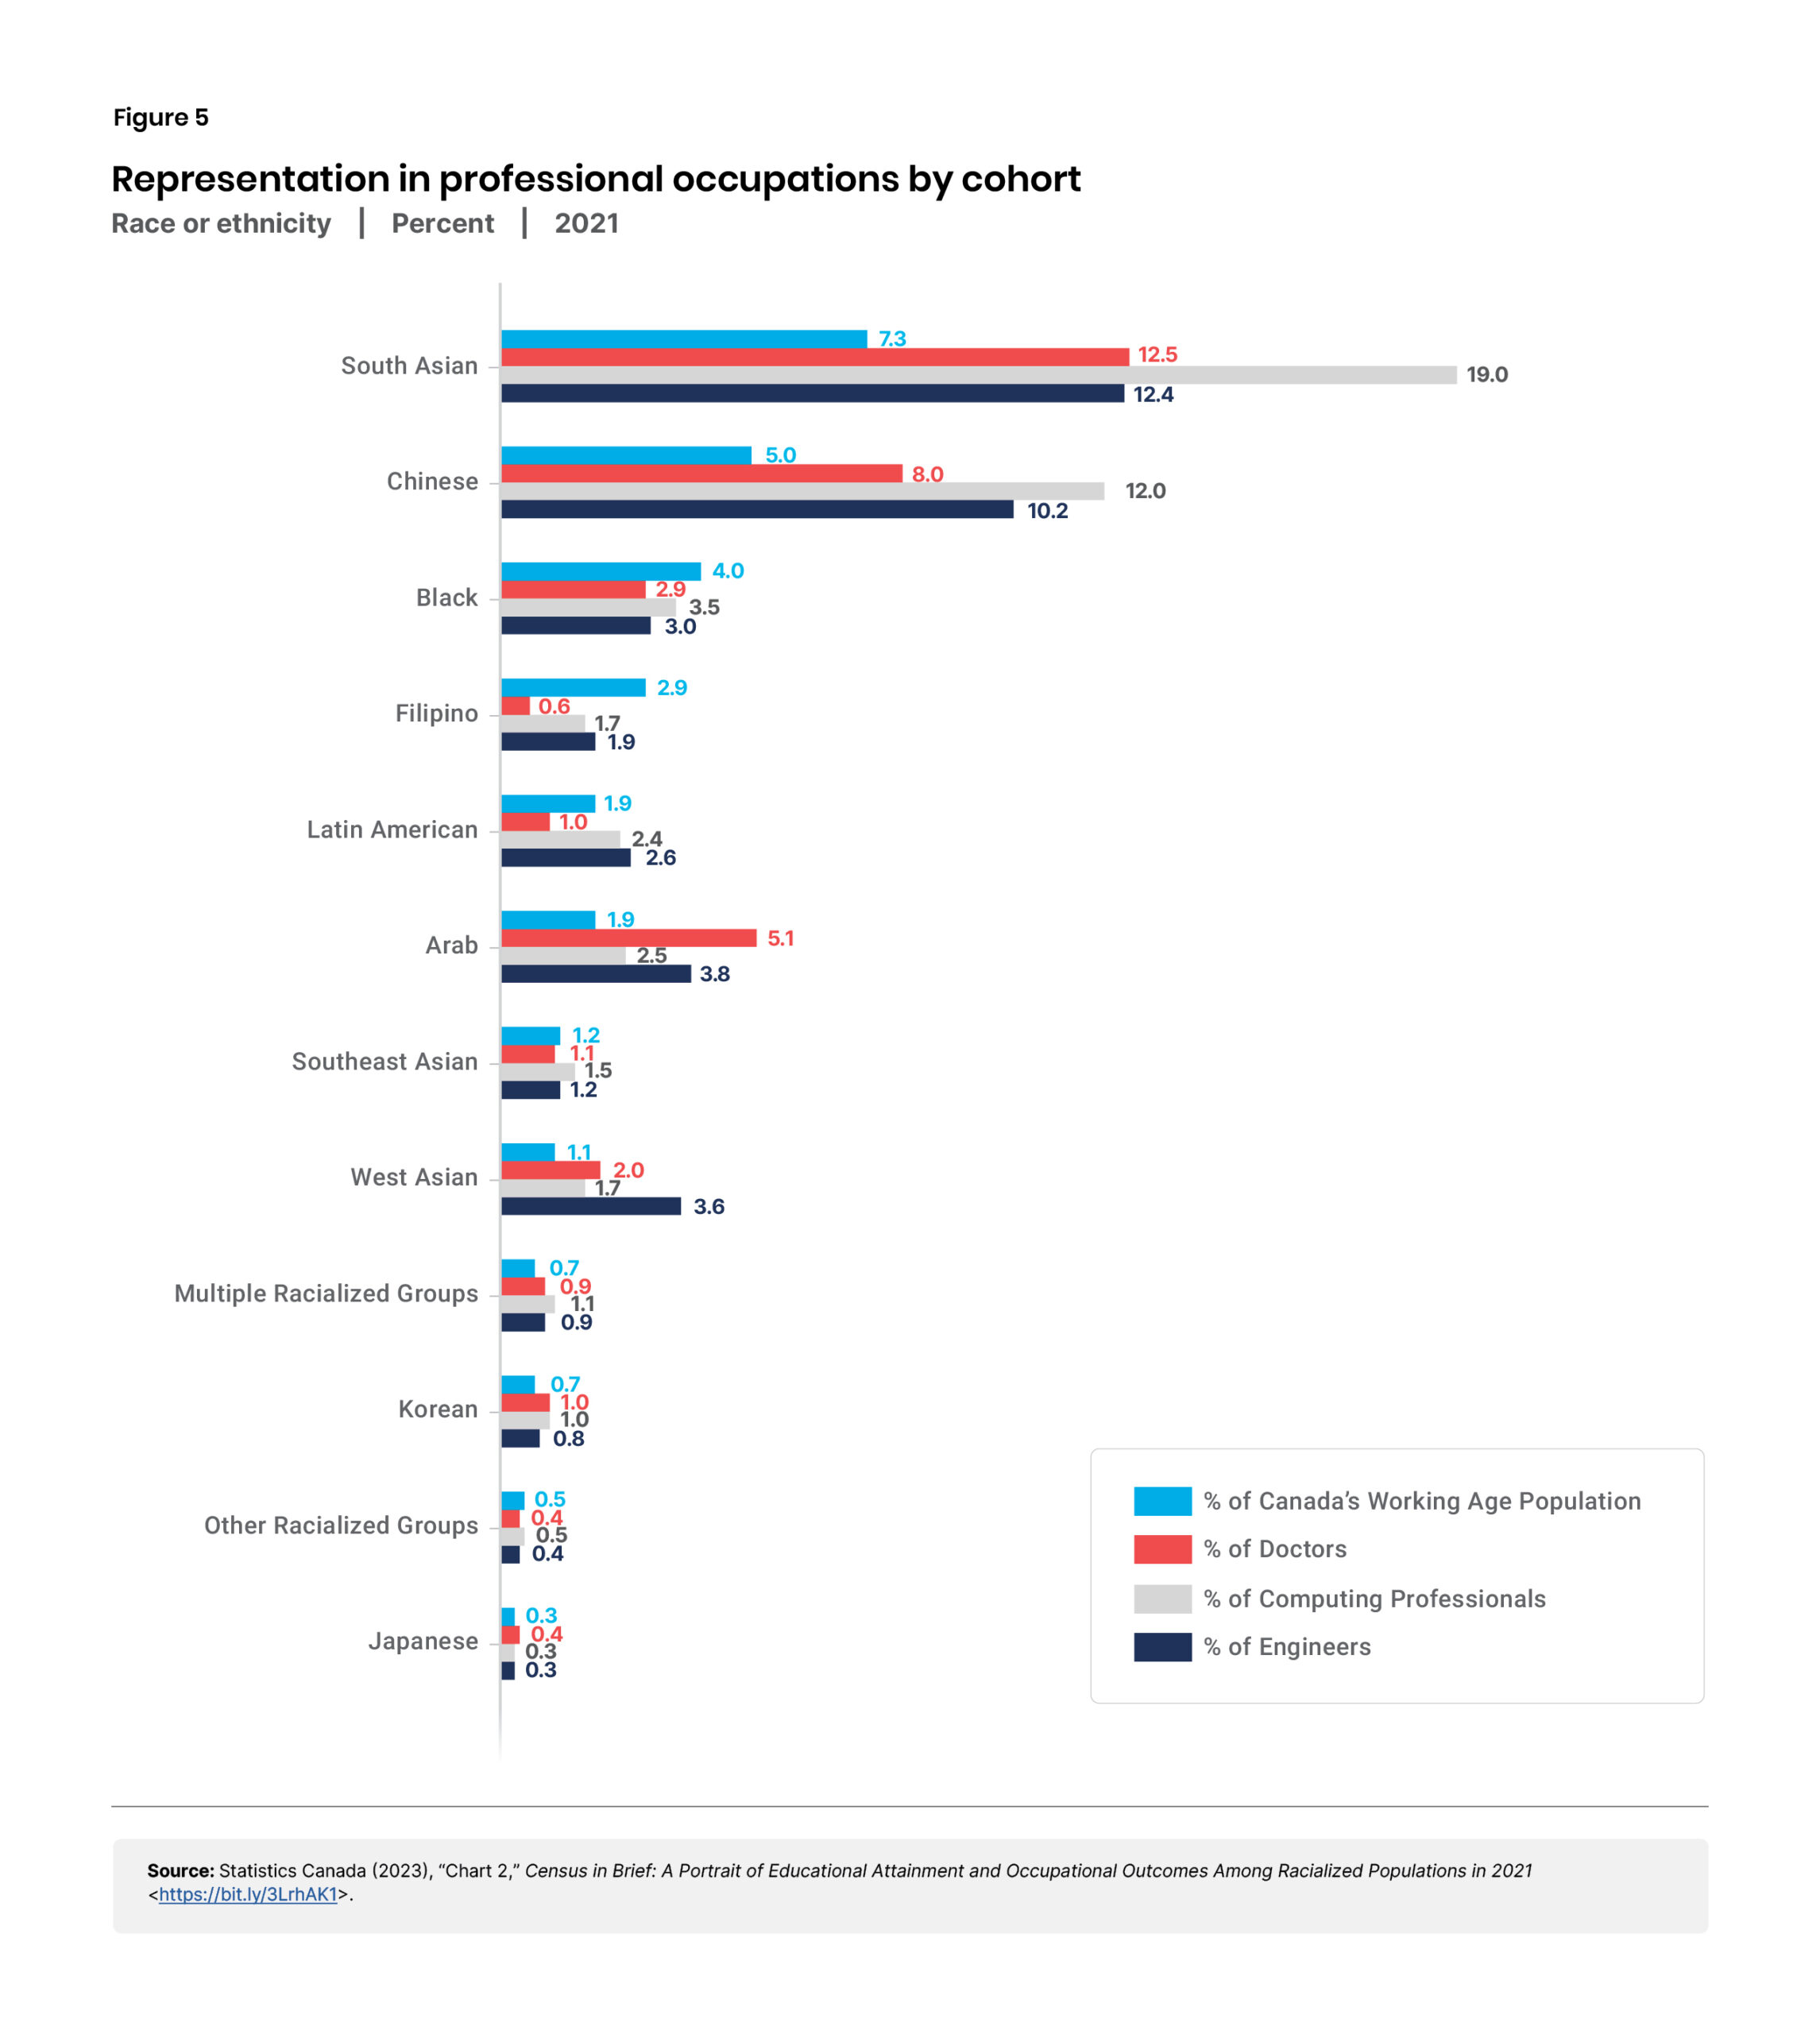
The data on occupational disparities also dispels the notion that the labour market discriminates against minorities. On the contrary, in Canada many visible minority populations are overrepresented (relative to their proportion of the workforce) in professional occupations such as medicine and engineering (Figure 5). For example, in Canada South Asians comprise 7.3 percent of the working-age population but account for:
Many other minority groups are overrepresented in these professions as well. For example, relative to their share of the working-age population, Canadians whose backgrounds are South Asian, Chinese, Arab, West Asian, Korean, Japanese, and “multiple racialized groups” are overrepresented among doctors. Latin Americans are underrepresented among doctors, but overrepresented among engineers and computing professionals.
Another institution in which racism is said to persist is the public education system. Staff with the Toronto District School Board’s Mathematics and Numeracy Department have given presentations suggesting that the province’s standardized testing was an example of “white supremacy in K-12 mathematics education.”9
Similarly, an executive with the Elementary Teachers’ Federation of Ontario wrote in the union magazine that standardized testing is “biased towards upper-middle class white test-takers” and suggested that “EQAO tests are culturally and racially biased, promoting a Eurocentric curriculum and way of life that privileges white students.”10
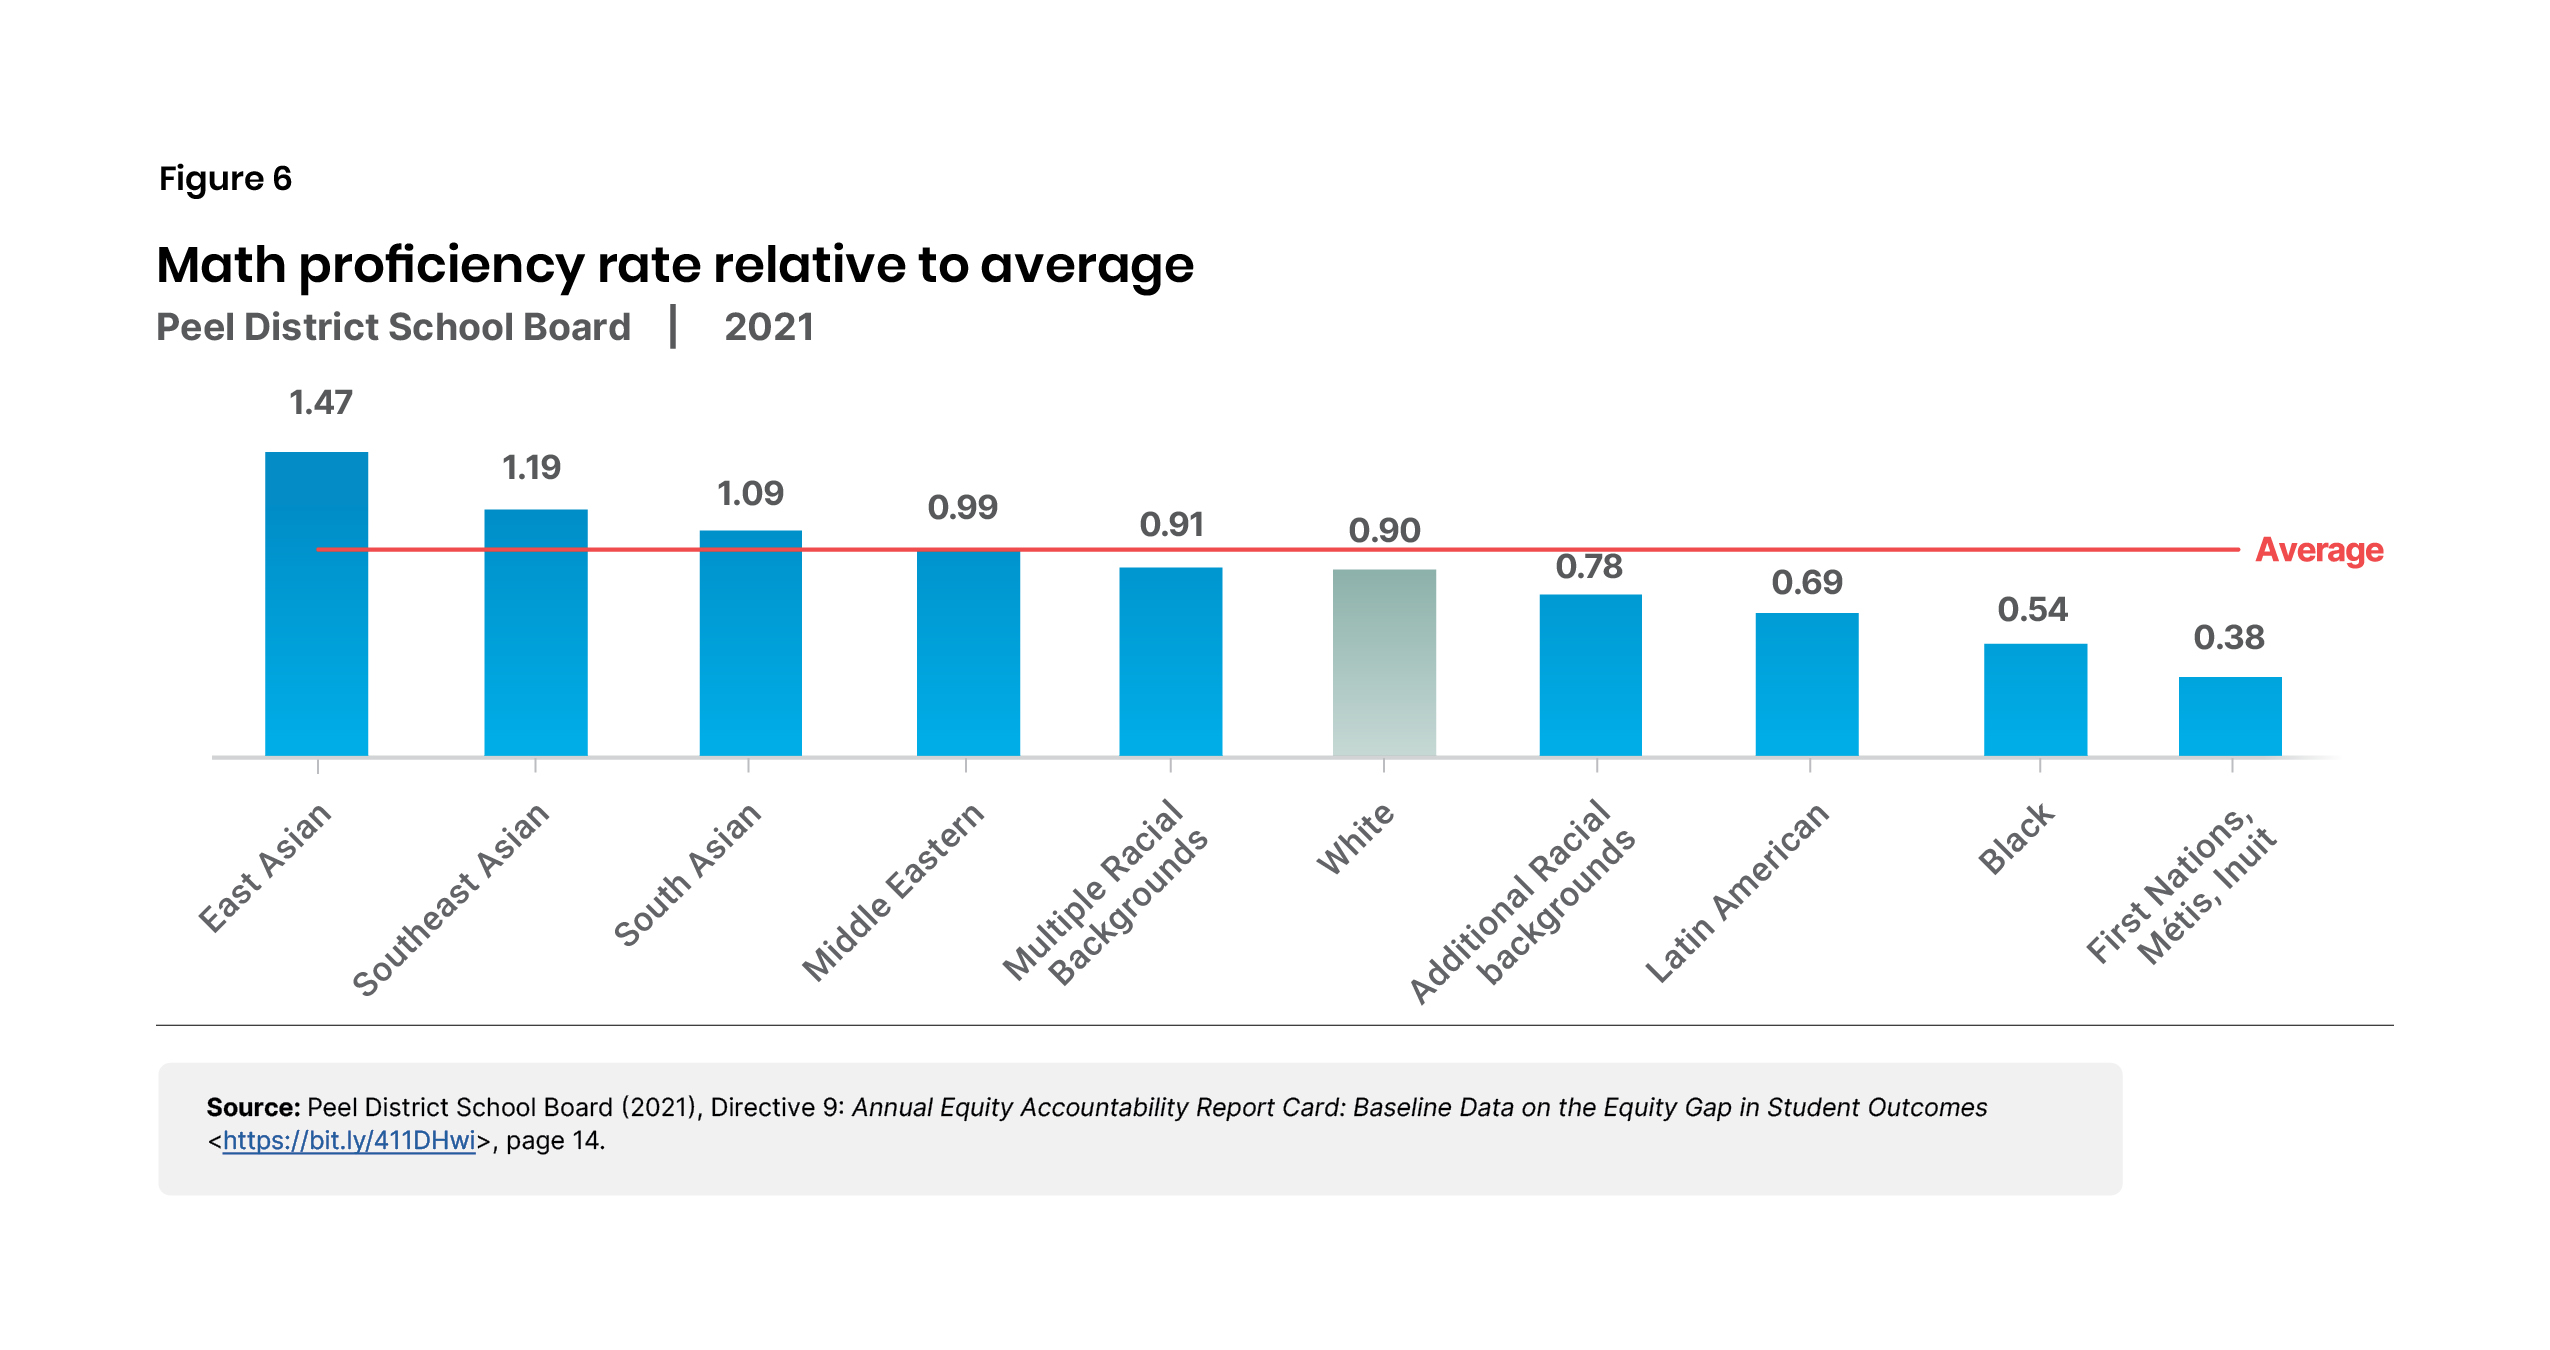
It is not just standardized testing that is said to give relative advantages to the white population, but in fact the entire school system. According to a booklet published by the Peel District School Board, “our system has been built upon colonial structures meant to uphold white supremacy.”11 Yet there is little evidence of white supremacy, particularly on the EQAO mathematics tests, in Peel Region or elsewhere.
In fact, at the Peel District School Board, grade six students from East Asian, South Asian, Southeast Asian, and Middle Eastern backgrounds all outperform the white students on average on the EQAO mathematics tests (Figure 6). White students in Peel are actually underrepresented among those meeting provincial standards in mathematics.12
Moreover, Peel District School Board data show that white students are more likely than the average to:
These are unexpected outcomes if the school system is built on structures that uphold white supremacy.
Data showing demographic breakdowns of student achievement are not published regularly by all school boards, but other data show similar results to those in Peel Region. For instance, the Toronto District School Board’s 2011-12 census found that for grade 6 students of South Asian (Sri Lanka, India, Pakistan, Bangladesh, Guyana)14 or East Asian (China, Hong Kong, Southeast Asia, and South Korea)15 backgrounds, each group outperformed the average in reading, writing, and mathematics EQAO tests with the single exception of Guyanese students in mathematics.
Similarly, data from the Grand Erie District School Board in Ontario finds that South Asian, East-Southeast Asian, and multiracial students on average outperform white students in grade 6 EQAO tests in reading, writing, and mathematics.16 Where it can be found, student test scores data are generally contrary to the notion that public schools are systemically racist against visible minorities.
Systemic racism in Canada is often said to particularly disadvantage Indigenous Canadians (First Nations, Metis, and Inuit). Undoubtedly many Indigenous Canadians have in the past and do today suffer harm from discrimination and deleterious government policies – for example, until 1960, First Nations could not vote unless they gave up their Indian status under the law, while today a lack of property rights worsens housing conditions on reserves.
A full discussion of the treatment of the Indigenous population is outside the scope of this Reality Check; nevertheless, a look at income statistics is helpful to understand the size of the disparity between Indigenous and other Canadians and the degree to which systemic discrimination might be to blame.
The latest figures (data are from 2020) show the median after-tax income for those from 25 to 64 years old to be $40,400 for Indigenous Canadians compared to $44,000 for non-Indigenous Canadians. While the median Indigenous Canadian’s income was 8.2 percent below the non-Indigenous level, the gap varies by Indigenous identity.
For First Nations people it is 11.2 percent; for the Metis population – which on average is more educated and likelier to live in urban areas than the First Nations – the gap with the non-Indigenous population is only 2.7 percent.17 This suggests that location and education are the main drivers of income disparities between Indigenous and non-Indigenous Canadians, leaving little room for systemic discrimination as an explanation.
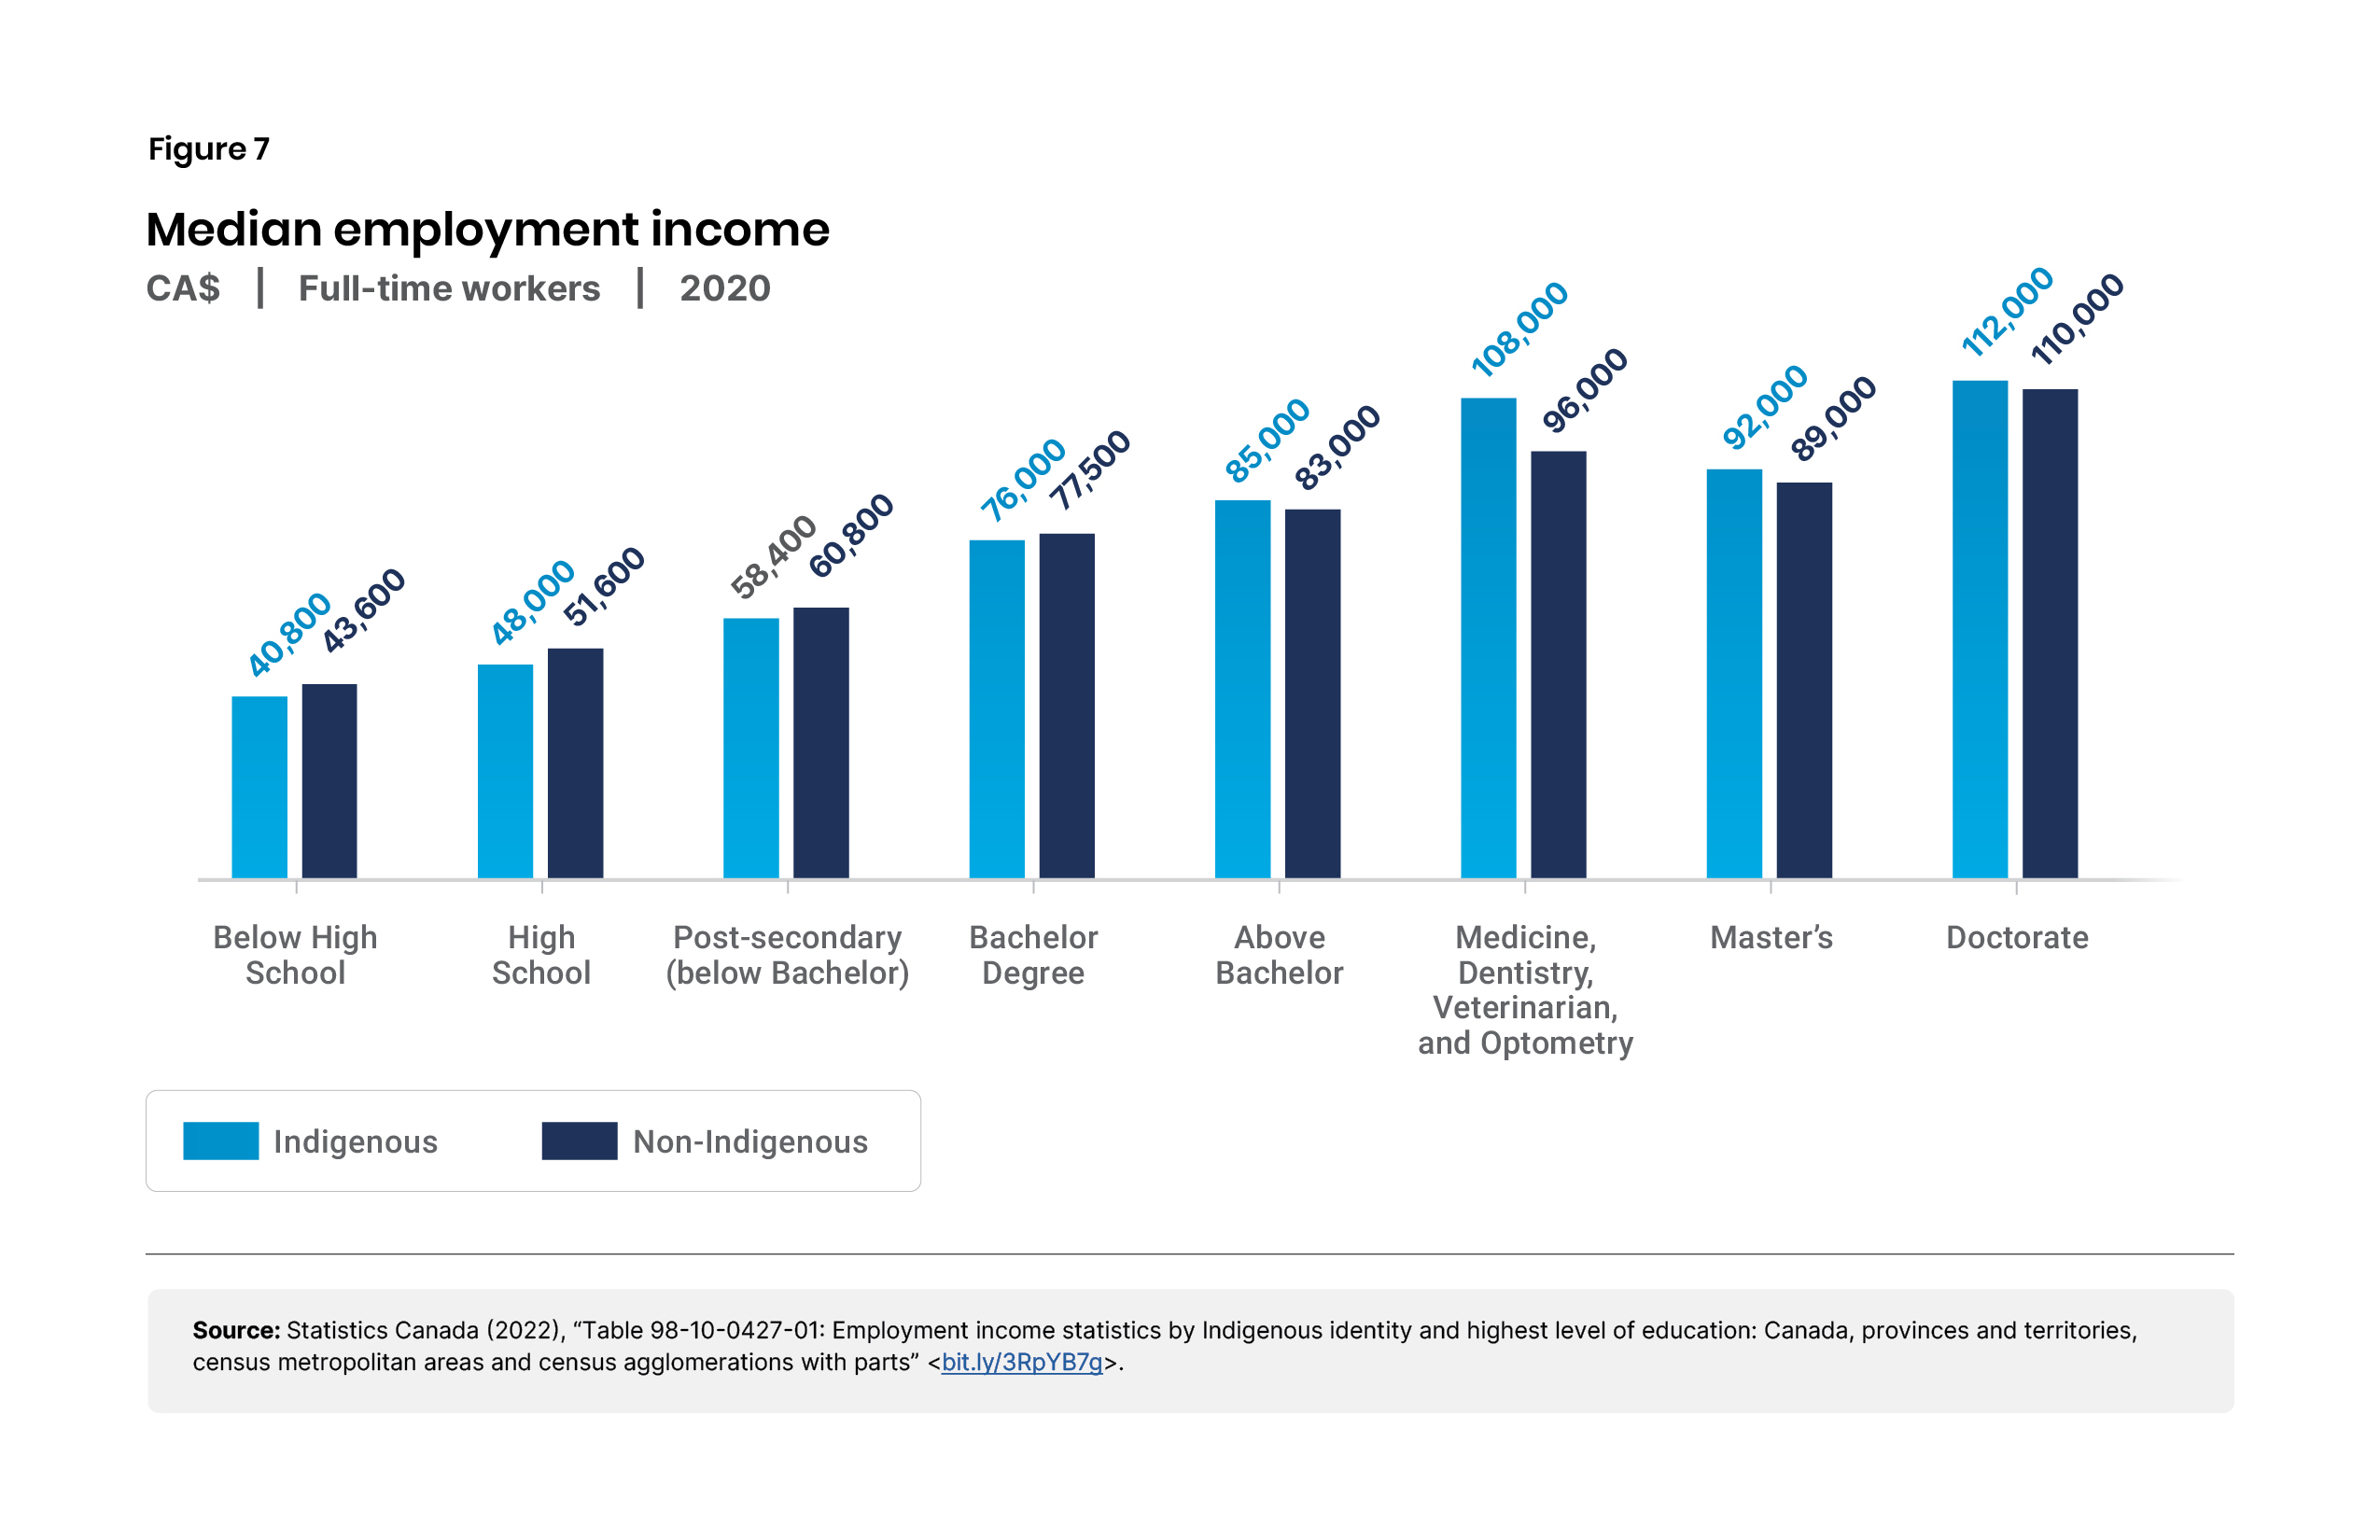
Indeed, after controlling for level of education and work status, Indigenous Canadians earn close to the same incomes as non-Indigenous Canadians. The median income for Indigenous Canadians who worked full-time for the full 2020 year was only slightly below the national average among people with a bachelor degree or lower, and slightly above the national average for those with a higher level of education (Figure 7).18
In short, systemic discrimination seems a poor explanation for the income disparities between Indigenous and non-Indigenous Canadians.
Pronouncements about systemic racism in Canada are overwhelmingly accompanied by prescriptions for top-down solutions including government regulations, federal programs, national strategies, and the like. Yet the historical evidence shows that less government, not more, is the key to reducing and mitigating the harms of discrimination.
“It is a striking historical fact,” Milton Friedman wrote in Capitalism and Freedom, first published in 1962, “that the development of capitalism has been accompanied by a major reduction in the extent to which particular religious, racial, or social groups have operated under special handicaps in respect to their economic activities; have, as the saying goes, been discriminated against.”19
More specifically, Friedman continued, “the preserves of discrimination in any society are the areas that are the most monopolistic in character, whereas discrimination against groups of particular color or religion is least in those areas where there is the greatest freedom of competition.” Gary Becker, Friedman’s student and winner of the 1992 Nobel Prize in economics, laid much of the foundation of the economic study of discrimination.
As the Concise Encyclopedia of Economics documents, Becker’s work showed that “discrimination is costly to the person who discriminates,” a fact that is now “common sense among economists today.” Unsurprisingly given this fact, “Becker showed that discrimination will be less pervasive in more competitive industries because companies that discriminate will lose market share to companies that do not. He also presented evidence that discrimination is more pervasive in more-regulated, and therefore less-competitive, industries.”20
More capitalism and freer markets is the antidote to unfair discrimination – not government regulation and control.
If the typical anti-racism activist in Canada today is looking for widespread institutional or systemic racism of the kind the federal government describes, they will not find it. Disparities in income, educational attainment, and other outcomes do not imply the existence of such discrimination. Moreover, the data on disparities in income, educational attainment, occupational outcomes, and public school test scores show that, on average, Asians are doing better than the white population.
The evidence to support the claim that Canada is rigged to disfavour racial minorities is indeed scant – at best. Just as importantly, the solution prescribed by those who make claims of widespread systemic racism – increasing top-down government interventions – is the wrong one and if implemented would do more harm than good.
Matthew Lau is a Senior Fellow with the Aristotle Foundation. A financial analyst by trade, his writing covers a wide range of subjects including fiscal policy, economic theory, government regulation, and Canadian politics. He holds a Bachelor of Commerce degree with a specialization in finance and economics from the University of Toronto, and is a CFA charterholder.
Image credits: iStock