

In 1867, Canada was birthed into a world of potentially chaotic change. Alaska, just acquired by the United States, created a new threat to the north. The U.S. Civil war was over but the massive Union Army that successfully fought it was still intact. President Ulysses S. Grant mused about annexing Canada. Manifest Destiny animated the American imagination.
Canada was formed under those conditions. Four British colonies found mutual interest and imagined a country with a central government and called themselves provinces.
Canada is no longer the Canada of 1867. In 1867, Canada’s population was nearing 3.5 million.1 As of 2026, it is nearing 42 million.2 In 1867, there was no Alberta, no Manitoba, no Saskatchewan.
In 1867, well over 80% of Canadians lived in rural areas. Today over 80% live in cities.
In 1867, women could not vote. Today they make up more than half of the electorate.
A true democracy is built on the principle of one person, one vote, and the equal weight of the same. Canada should be defined by that practice. That was not the case in 1867, but we have been consistently willing to change policy over time to reflect that principle. Women gradually received the right to vote federally and in the provinces between 1917 and 1940. It took decades longer before Canada moved to reflect that principle more directly when Canadians of Chinese, Japanese, and South Asian ancestry received the right to vote federally in 1947. Inuit women were given the right to vote in 1950. First Nations men and women were given the unequivocal right to vote federally in 1960. In 2026, it is essential that the principle of one person, one vote—equally weighted—be reinforced and revitalized in Canada.
That founding principle of democracy has been severely eroded in Canada today. Different citizens in different parts of the country have different rights—whether they are indigenous or non-indigenous, or are considered “privileged” or “oppressed.” When Canadians go to the ballot box and cast a vote more inequality results: the weight of their vote differs by province, with some worth more and others worth less.
The further we stray from that principle of equality of citizens, the further we stray from the government’s role as servant of the people. This Aristotle Foundation report highlights the realities of today. In outlining the realities that confront us and the remedies that are available to us, the Aristotle Foundation asks us to think about how we can change things to bring a true balance to Canada as we face an uncertain world.
Each Canadian deserves an equal voice and equal vote with equal weight in making the choices that confront us.
—The Honourable Gordon Campbell was premier of British Columbia from 2001 to 2011.
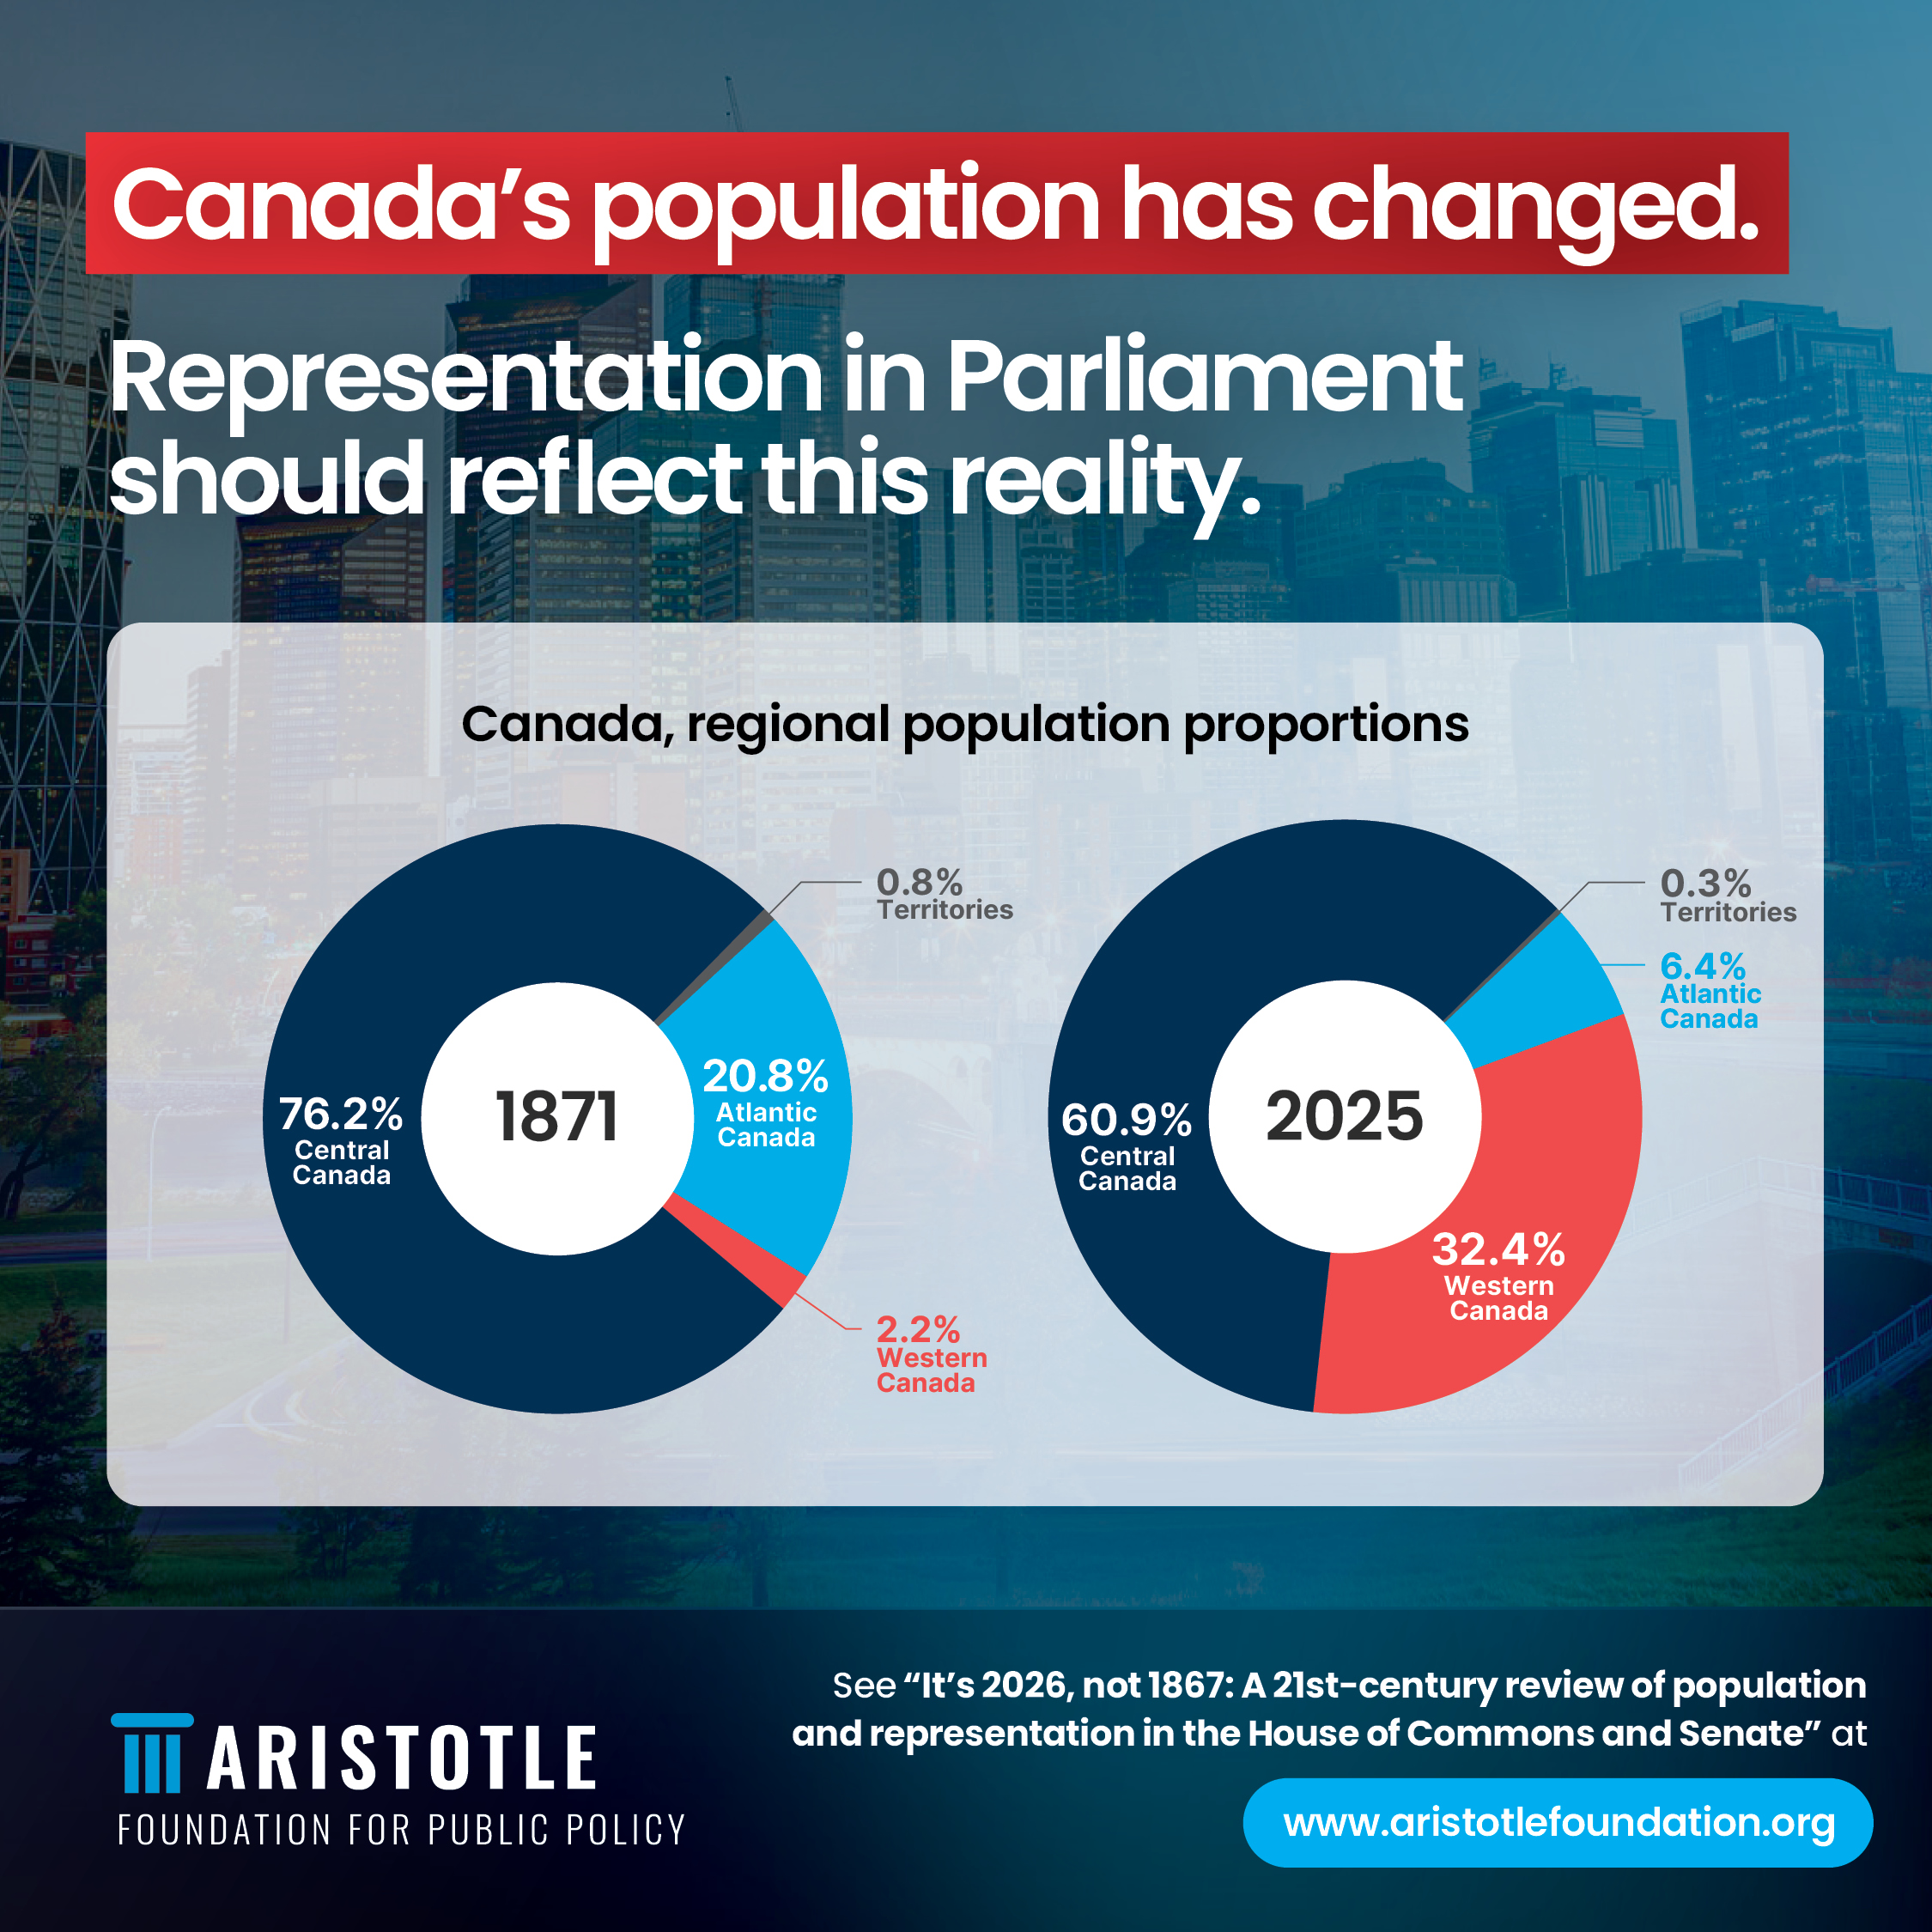
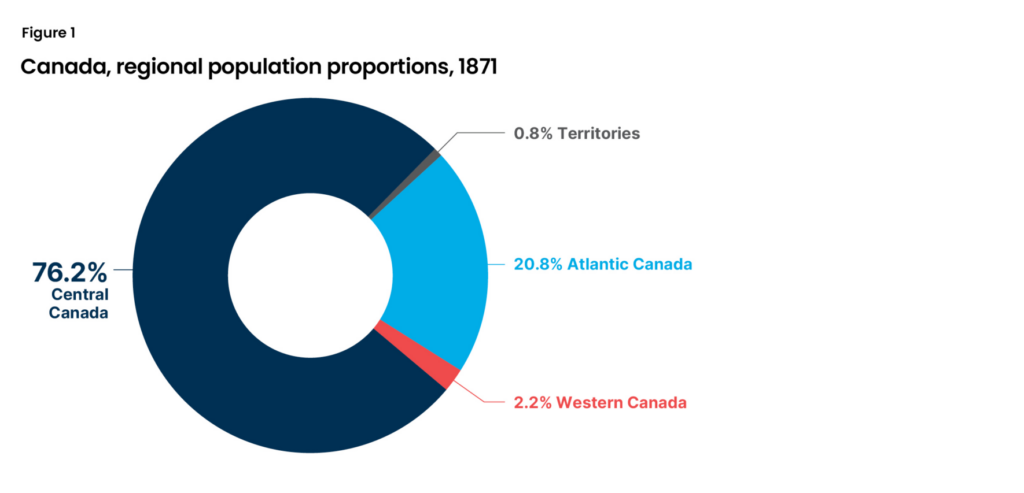
In 1871, four years after Confederation, Canada’s first census showed that Central Canada (Ontario and Quebec) possessed over 76 percent of the young country’s population, followed by Atlantic Canada with nearly 21 percent, while Western Canada’s population constituted just over 2 percent.
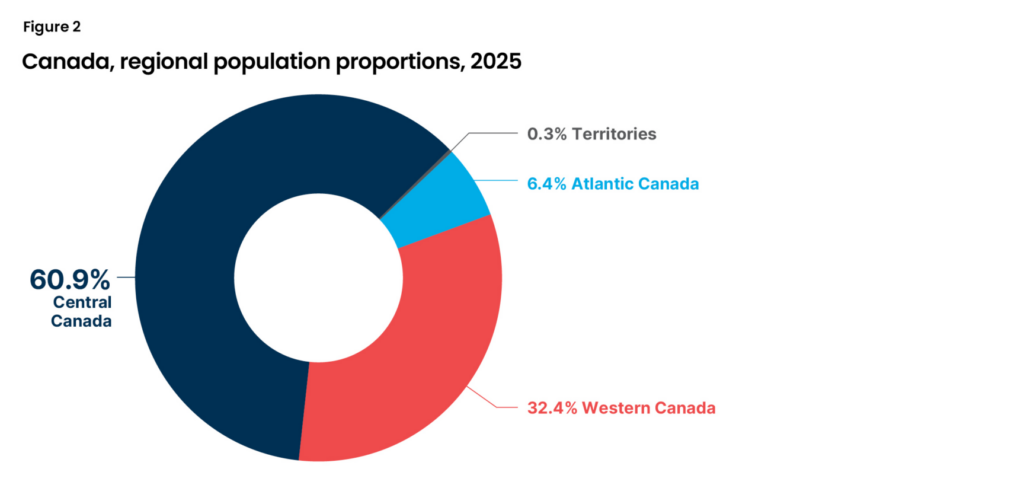
In the election year of 2025,a Central Canada’s proportion of the national population was still dominant, with just under 61 percent; Atlantic Canada’s share was just over 6 percent, while Western Canada’s population neared one-third of Canada’s demographic makeup at just over 32 percent.
Our goal in this analysis is to show the realities of disparities by province and by region as they concern representation by population in the House of Commons and the Senate. This study thus catalogues the representational realities of 2025 and offers a scenario whereby more equal representation could be achieved in the House of Commons. It does so based upon the realities of much closer one-person, one-vote assemblies in other Anglosphere countries: The United Kingdom, New Zealand, and Australia. All three nations, in their lower houses—akin to Canada’s House of Commons—rigorously reapportion seats based on population changes. By so doing, they hew much closer to the desirable principle of the equality of voters across the country.
For example, in response to a 2023 review of Westminster constituencies in the United Kingdom, which became effective for the 2024 election, England gained 10 constituencies, Northern Ireland’s seat count remained unchanged, Scotland lost two constituencies, and Wales lost eight constituencies. The United Kingdom’s House of Commons Library notes the 2024 reform ended the “over-representation of Wales 25 years after devolution.” Acknowledging population realities in Canada in 2025 is not a revolutionary act.
We know that reform of Canada’s House of Commons for strict representation by population, along with reform of the Senate to actually better reflect the regions, would require legal and even constitutional changes, which seem unlikely at present. However, we have prepared this analysis on the assumption that Canadians can count, and that citizens in underrepresented provinces—Alberta, British Columbia, and Ontario—may become more and not less animated if separatist sentiment and demands “flare up” again, not only in Quebec but also in Western Canada.
a Note that we use 2025 data for comparative purposes, given the most recent federal election took place in 2025.
Of critical relevance, a 2014 Supreme Court of Canada decision made the Senate virtually unreformable. That makes the case for closer representation by population in the House of Commons even stronger, given that the Senate is permanently unrepresentative whether measured by province or by region. In the 21st century, Canadians deserve at least a House of Commons that reflects today’s provincial population realities, not those of 1867.
As we noted in our 2025 Reality Check about polling on separatist sentiment in Quebec and in the West,b some polls found 1970s- and 1980s-era Quebec-style support for separation—with the potential to rise—in Saskatchewan and Alberta. That, combined with recent polling from Quebec showing that the separatist Parti Quebecois may win a 2026 provincial election, could indeed inflame tensions within Confederation. At a minimum, Canadians should be prepared for such a possibility and be familiar with the hard numbers in terms of representation.
After all, should separatist sentiment spike in the West or in Quebec, significant change to political representation might become more plausible and even necessary if the choice for Canada becomes stark: change, compromise, and “muddle through” as a unified nation-state; or attempt to lock in 1867-derived advantages, reinforce the status quo, and potentially fracture Canada.
Lastly, our polling from Léger in February 2026 found the following:3
We thus posit the following: democratic legitimacy rests in part upon a demonstrable, rough equality of voters, and Canada is the outlier in this regard. Canada’s political institutions should thus be reformed based upon 21st-century realities in order to renew a sense of fairness nationwide.
b For 2025 poll numbers on Quebec and Western separation and the potential for a rise in separatist sentiment in both, see our June 2025 Reality Check, “Separatist Sentiment: Polling comparisons in the West and Quebec.”
c Note that due to decimal points, the figure of 66% was rounded up from “Somewhat Agree” at 20.3% and Strongly Agree” at 45.5%, in response to this question: “When it comes to the House of Commons do you agree or disagree with the principle that all Members of Parliament should represent approximately the same number of people?”
Our goal in this analysis is to show the realities of disparities by province and by region as they concern representation by population in the House of Commons and also the Senate. This is informed by the common-sense principle in a democracy that Canadians deserve a House of Commons and a Senate that reflect 2026 realities,d not those of 1867 or even 1982.e
A concurrent goal is to address significant Western discontent based upon the realities of underrepresentation but also to make clear that any reform, if possible, would also involve increasing seats in Ontario in the House of Commons. Selected legitimate grievances exist in Western Canada and should be addressed. On representation in the House of Commons, however, Ontario is also underrepresented. Here, we detail various ways to understand the political underrepresentation of selected provinces.
In other words, while legitimate discontent exists in Western Canada on a number of files—inadequate representation, fiscal transfer flows via the federal government that reward poor economic policy in “have-not” provinces,4 and other deliberate policy that disadvantages the West—Western Canadians must also recognize that if House of Commons representation were to more closely match population by province, British Columbia and Alberta would benefit but so, too, would Ontario.
This study thus catalogues the representational realities of the most recent federal election year (2025) and offers a scenario whereby more equal representation could be achieved in the House of Commons. It does so based upon the realities of much closer one-person, one-vote assemblies in other Anglosphere countries: The United Kingdom, New Zealand, and Australia. All three nations, in their lower houses—akin to Canada’s House of Commons—rigorously reapportion seats based on population changes. By so doing, they hew much closer to the desirable principle of one person, one vote.
To place the constitutional and political design of Canada in context, consider the comparison of Canada’s population by region in Canada’s first census in 1871, with the population by region as of 2025 (Figures 1 and 2).
d Note that we are using 2025 population statistics to correspond with the most recent federal election year, 2025, in this analysis.
e 1982 was the year of the repatriation of the Constitution from the United Kingdom and the creation of the Constitution Act.
Sources: Authors’ Calculations from Statistics Canada (n.d.), Census of Canada: 1890-1891, Government of Canada, pp. 366-367 <https://publications.gc.ca/collections/collection_2016/statcan/CS98-1891-1.pdf>; Statistics Canada (2025), “Population estimates, quarterly—Table 17-10-0009-01,” Statistics Canada (December) <https://www150.statcan.gc.ca/t1/tbl1/en/tv.action?pid=1710000901>.
Note: In 1871, the Prairies included the districts of Alberta, Assiniboia, Athabasca, Manitoba, and Saskatchewan. We are including British Columbia in the 1871 Western Canada figures for an apples-to-apples comparison. Note that Newfoundland and Labrador were not part of Atlantic Canada in 1871 but are included in the 2025 calculation.
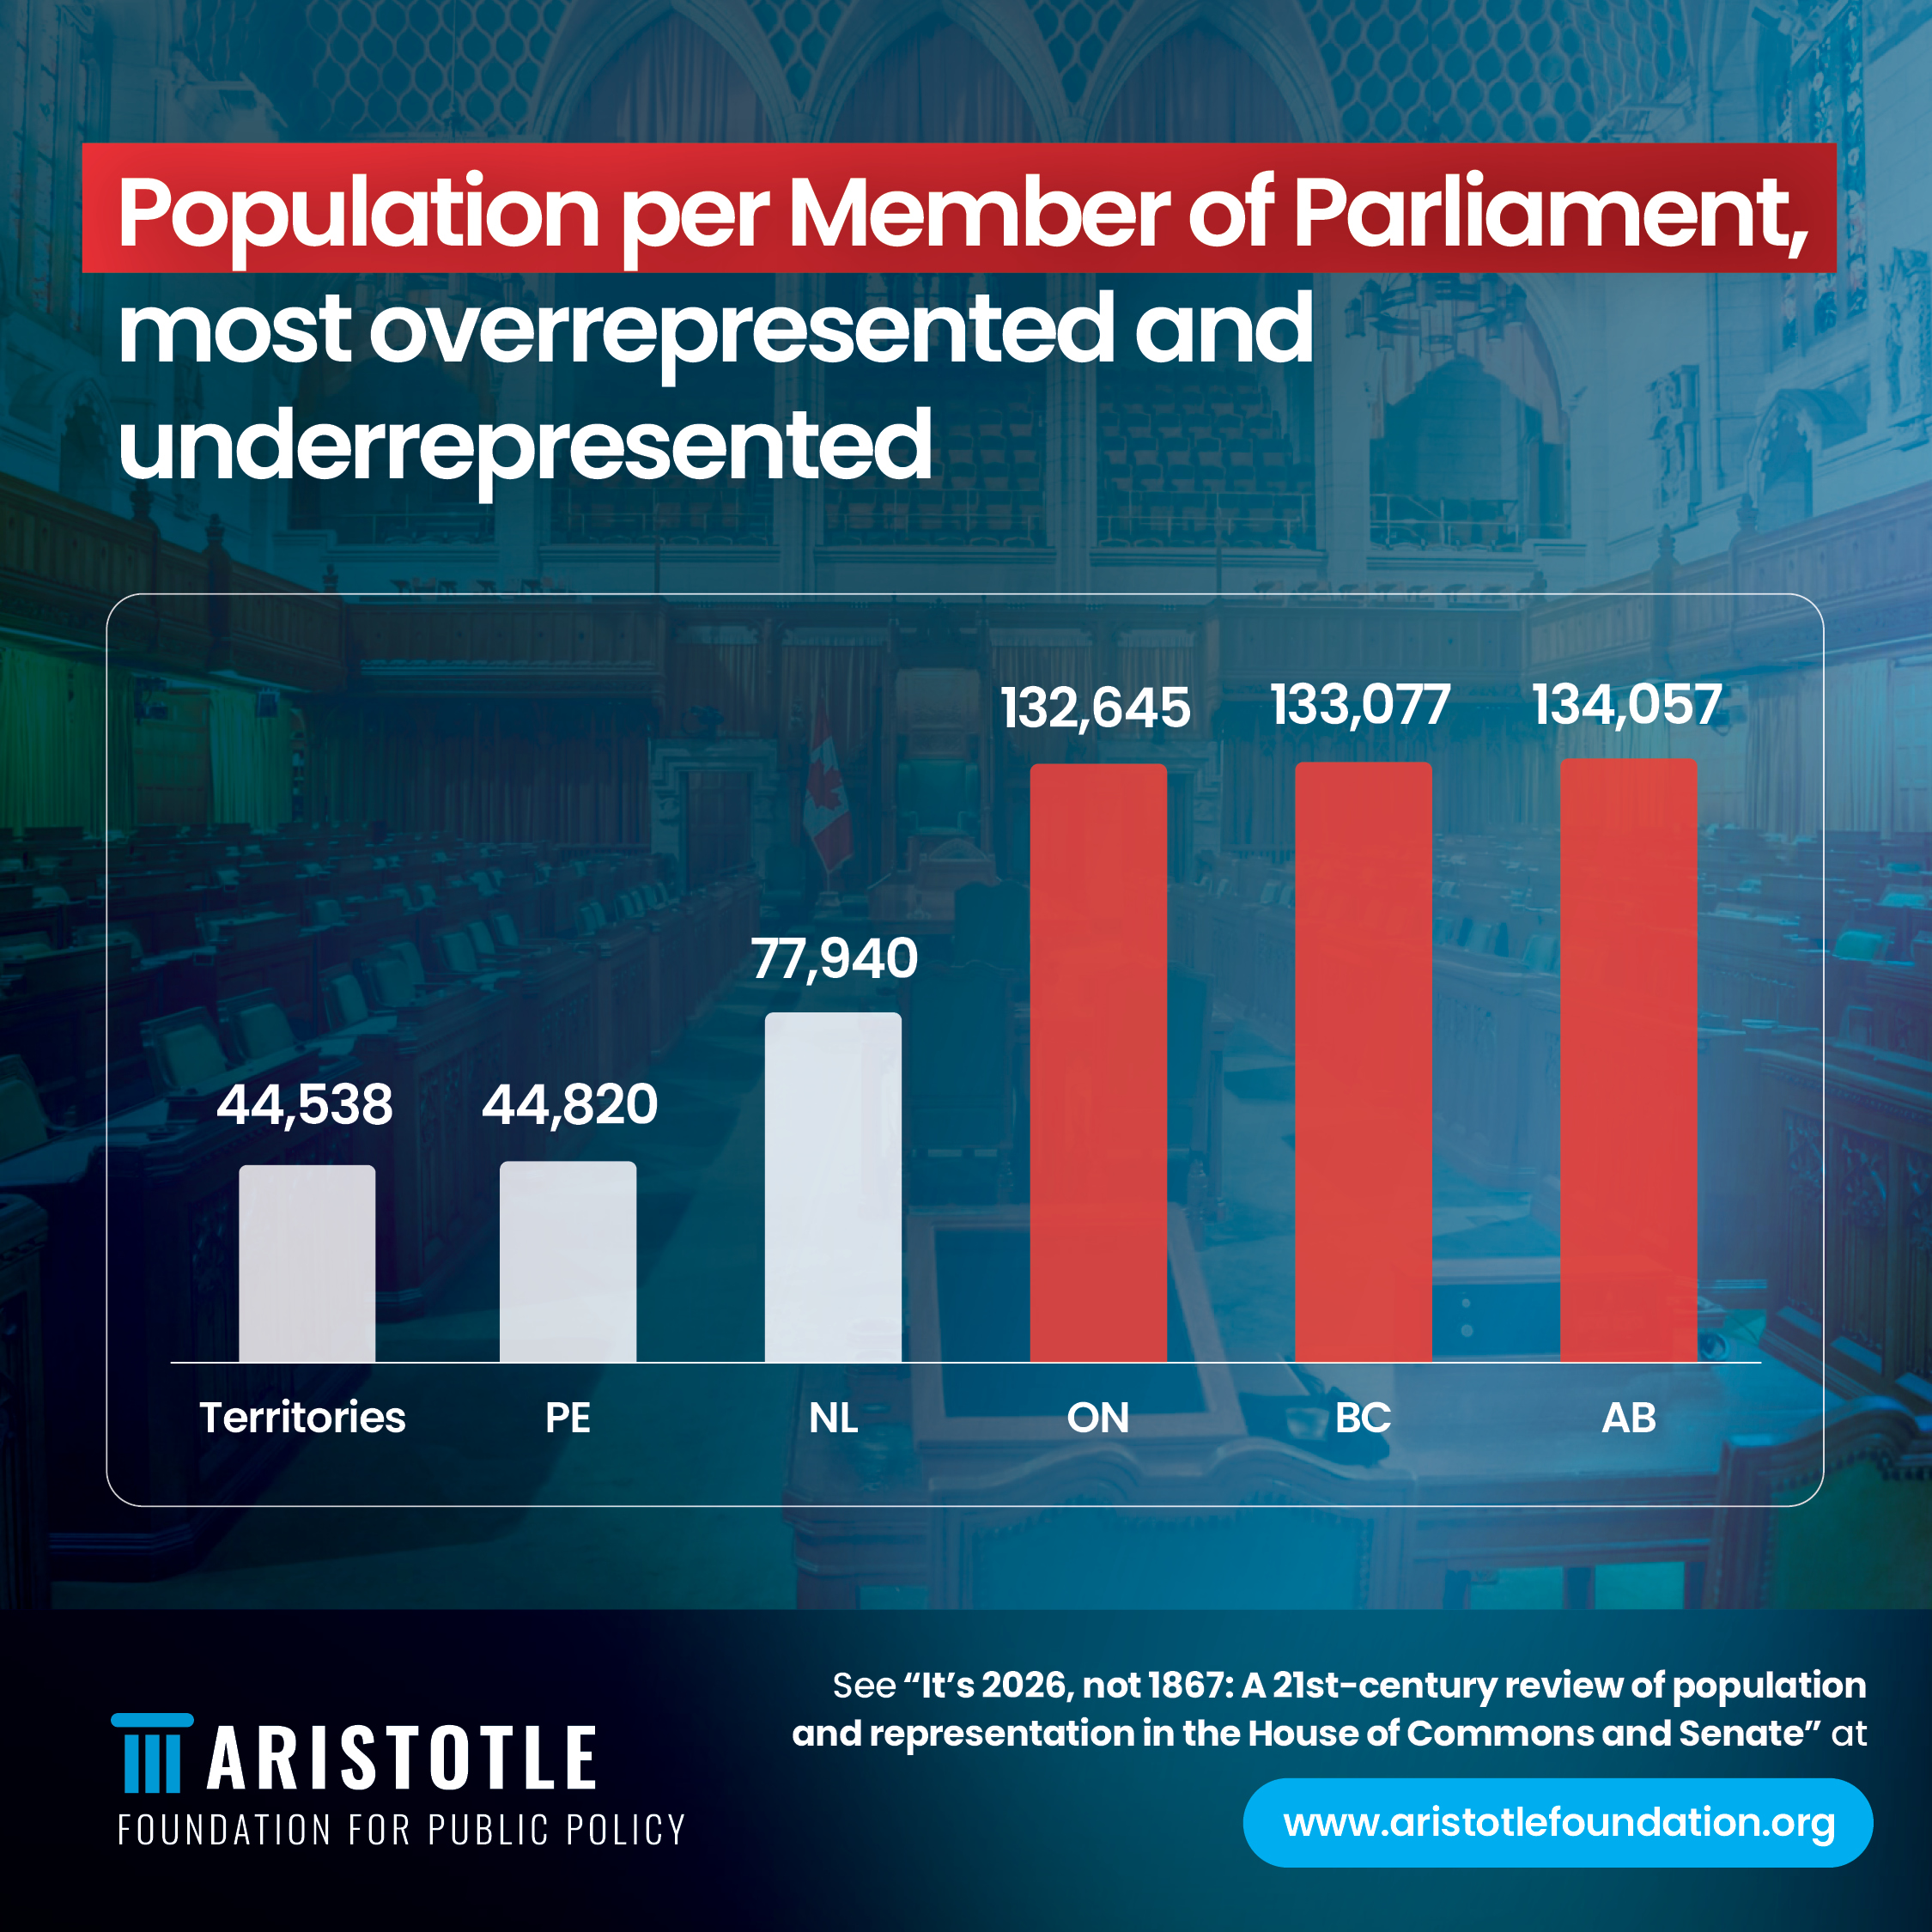
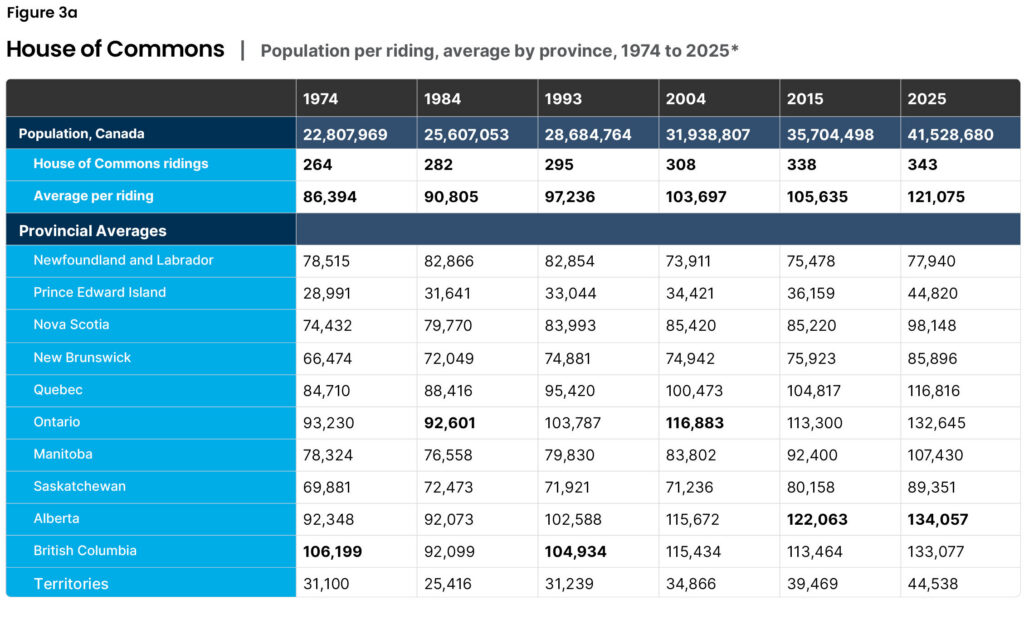
We analyzed elections and population data between 1974 and 2025 and found that Alberta, British Columbia, and Ontario are consistently underrepresented compared with the other seven provinces (Figure 3a). Over the six decades, and examining six elections that occurred within nine to eleven years of each other, Ontario, British Columbia, and Alberta were each underrepresented in two elections each relative to their population numbers and to other provinces.f
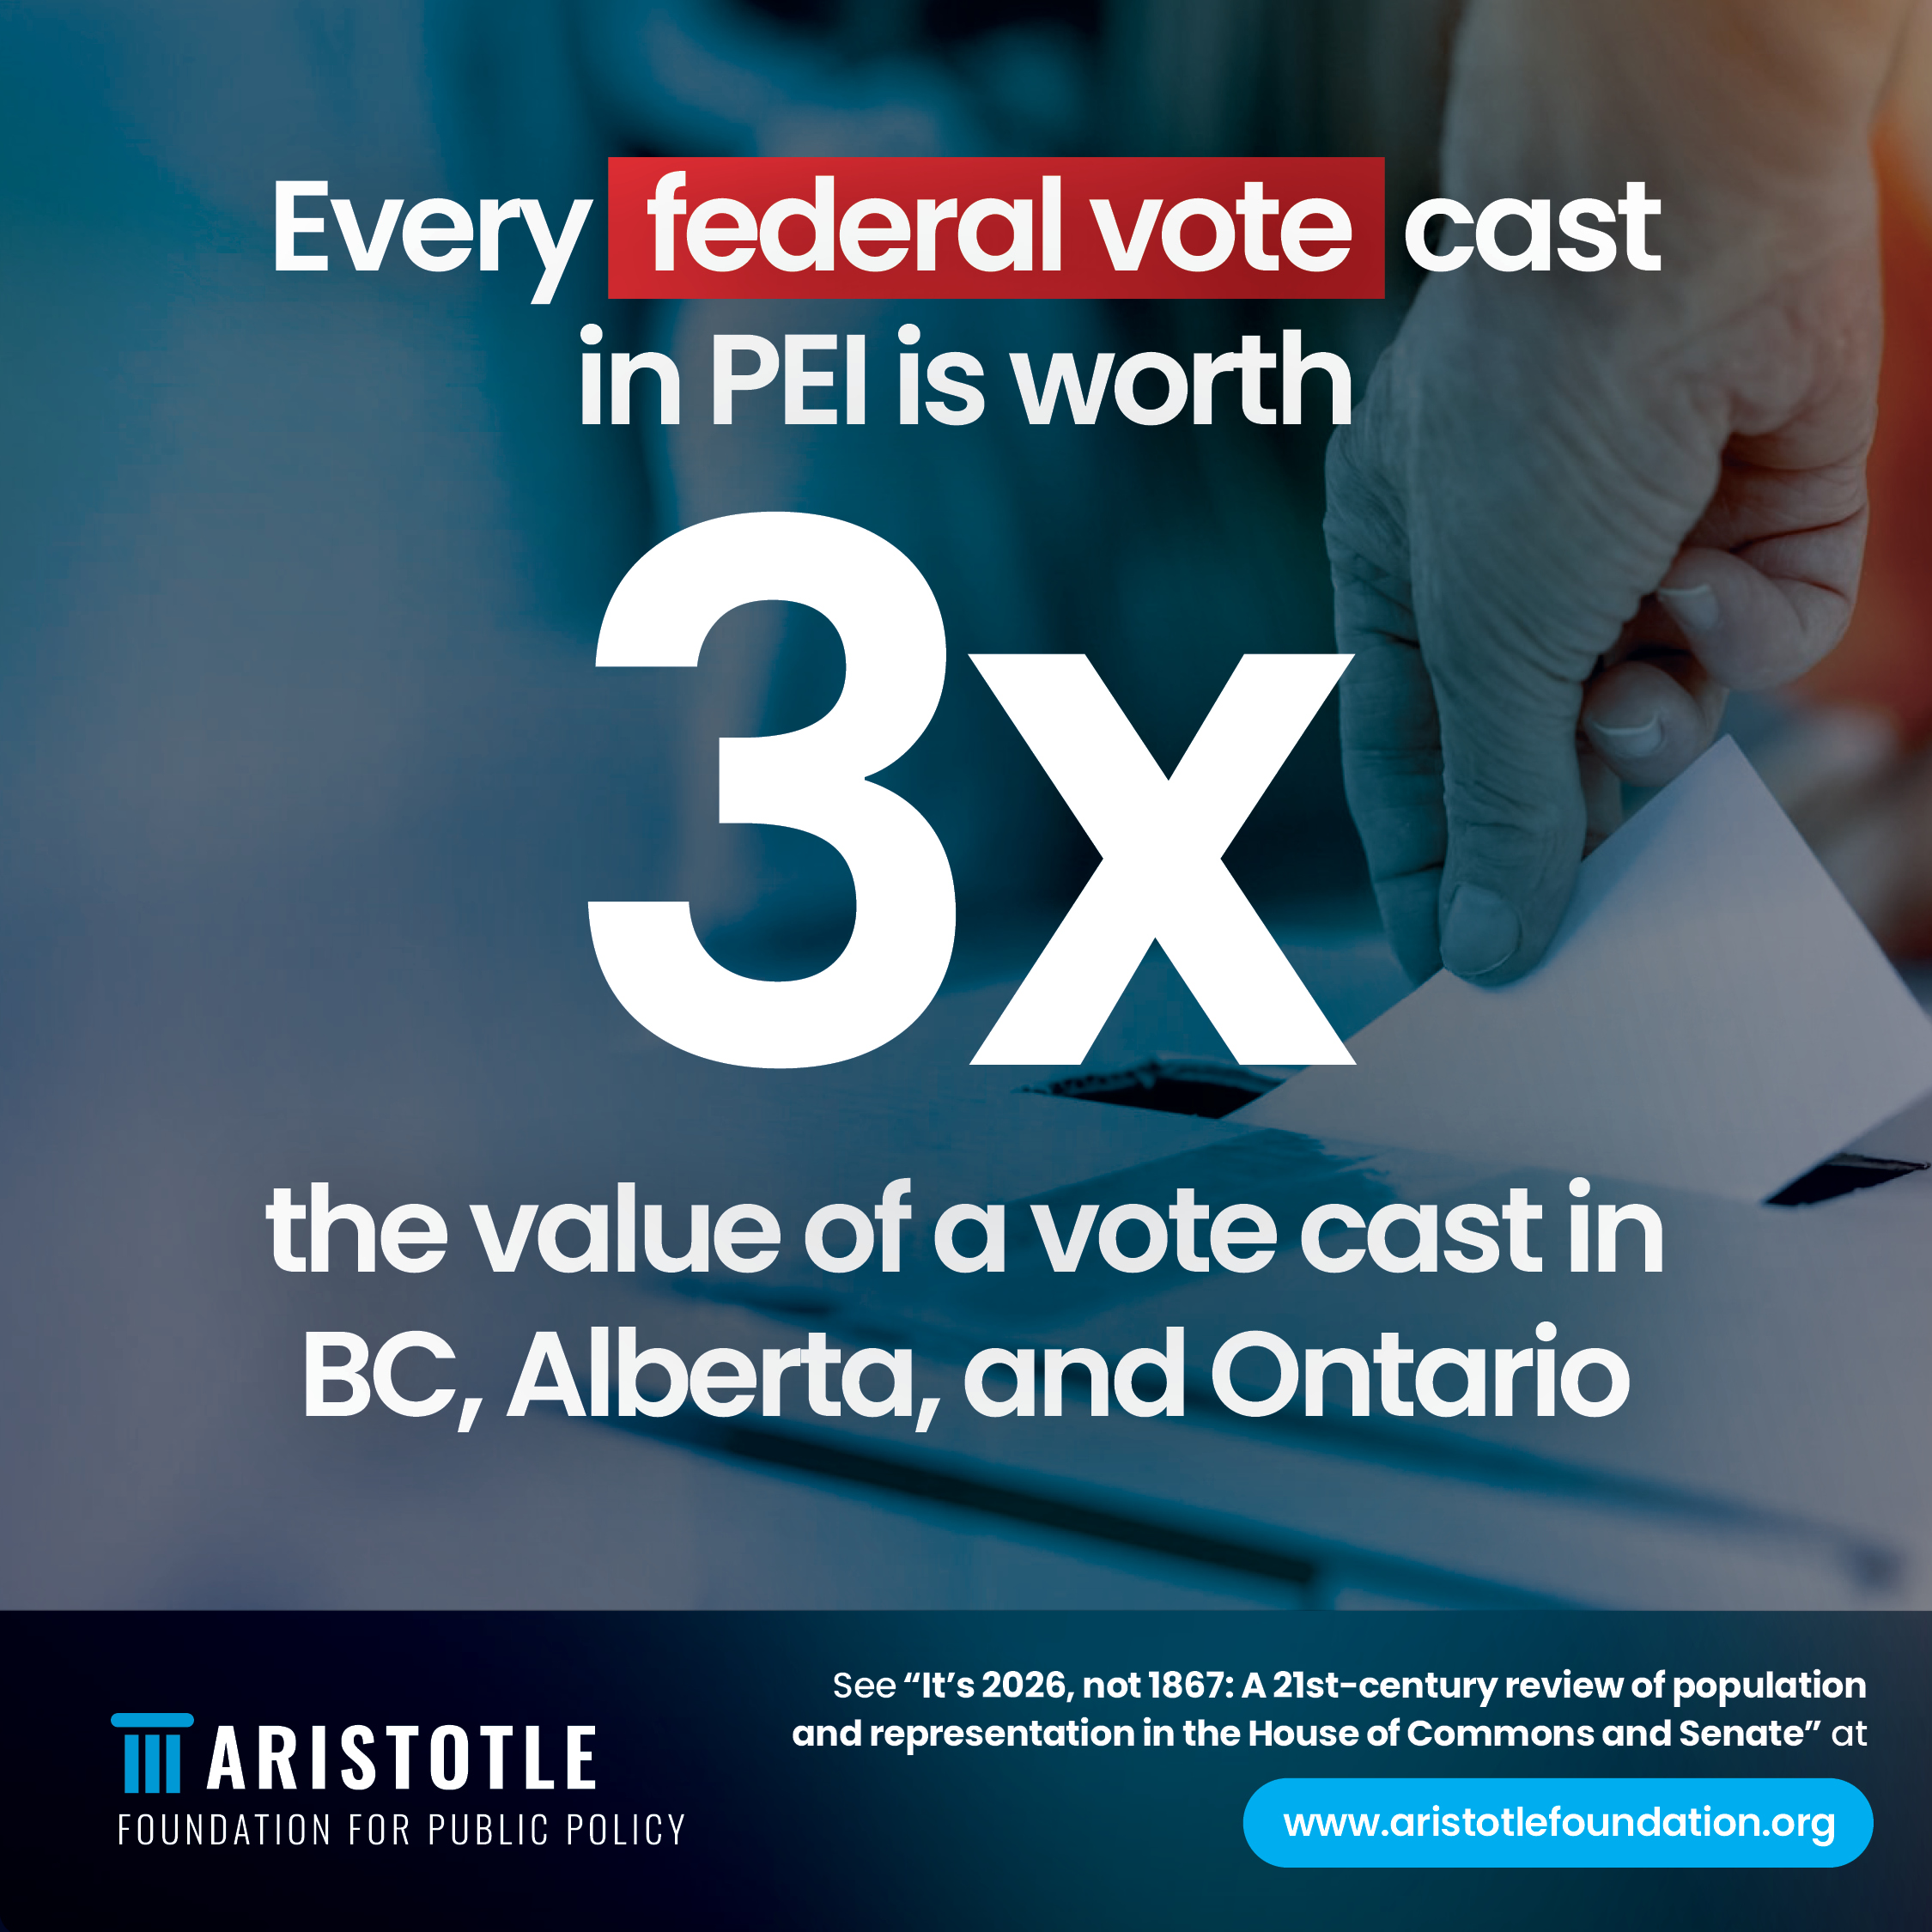
In 2025, in Alberta, British Columbia, and Ontario, the Members of Parliament (MPs) represented 134,057, 133,077, and 132,645 people, respectively, with Quebec representing 116,816, while each Prince Edward Island MP represented just 44,820 people. Or, expressed another way: a federal vote cast in Prince Edward Island is worth roughly three times that of a vote cast in Alberta, British Columbia, or Ontario. We note this as Prince Edward Island is the outlier but an important comparison to the most underrepresented province: British Columbia. Of relevance, while British Columbia joined Confederation in 1871, Prince Edward Island joined in 1873. One hundred and fifty-five years later, the province that joined Canada two years before Prince Edward Island is still the most underrepresented province in Canada.
The overrepresentation and underrepresentation have not changed significantly in the six decades examined. The provinces underrepresented in 1974—Alberta, British Columbia, and Ontario—were still the three provinces underrepresented 51 years later in 2025.
This imbalance is due to constitutional and legal provisions that guarantee ongoing inequality between the provinces despite population shifts over time.5 Provisions include the “Senatorial Clause” where no province shall have fewer MPs than it has senators. This is why Prince Edward Island has four senators and four MPs, even though in a strict representation-by-population scenario it would have just two MPs. Provisions also include the “Grandfather Clause,” where no province will have fewer MPs than they had in the 2019 election.6 The reality of the Senatorial Clause and the Grandfather Clause is a “sticking point” for those in Western Canada and Ontario, desirous of rebalancing House of Commons representation.
It may be argued that lower-population provinces or geographically large provinces deserve overrepresentation. However, Canada has both types of overrepresentation, i.e., in the House of Commons and the Senate. Thus, unlike some other nation-states, the upper house (the Senate) does not regionally counter-balance the overrepresentation in the lower house (the House of Commons) but parallels it: the same provinces underrepresented in the House are underrepresented in the Senate.
f The territories are also vastly overrepresented in the House of Commons but for the purposes of this study we recognize the even more vast distances in the Canadian north as opposed to those in the south, and thus focus on the provinces, where populations are, even in Atlantic Canada, significantly higher.
Further, it may be additionally asserted that game theory calculations would lead to a continued “stall” in any reform of Canada’s system of representation.7 After all, Ontario, the most populous province in Confederation, already has significant representation in the House of Commons, and thus Ontarians may have little interest in parliamentary reform. The question then becomes when might such issues become politically salient?
We know that reform of Canada’s House of Commons for strict representation by population, and reform of the Senate to actually better reflect the regions, would require legal and even constitutional changes, which seem unlikely at present. However, this analysis has been prepared on the assumption that hard numbers will count if constitutional “wrangling” again occurs. That includes the possibility that citizens in underrepresented provinces—Alberta, British Columbia, and Ontario—may become more and not less animated if separatist sentiment and demands “flare up” once again, not only in Quebec but also in Western Canada.
As we noted in our 2025 Reality Check about polling on separatist sentiment in Quebec and in the West, some polls found 1970s- and 1980s-era Quebec-style support for separation—with the potential to rise—in Saskatchewan and Alberta.8 That, combined with recent polling from Quebec showing the separatist Parti Quebecois in contention to win a 2026 provincial election,9 could indeed inflame tensions within Confederation. At a minimum, Canadians should be prepared for such a possibility and be familiar with the hard numbers of representation in Canada’s institutions.
Sources: Authors’ calculations from Marc Bosc and André Gagnon, Eds. (2017), “The House of Commons and Its Members” in House of Commons Procedure and Practice, Third edition (Éditions Yvon Blaise) <https://www.ourcommons.ca/procedure/procedure-and-practice-3/ch_04_1-e.html>; Statistics Canada (2025), “Population estimates, quarterly—Table 17-10-0009-01,” Statistics Canada (December)<https://www150.statcan.gc.ca/t1/tbl1/en/tv.action?pid=1710000901>; A. Heard (n.d.), “Canadian election results: 1867-2021,” Simon Fraser University <https://www.sfu.ca/~aheard/elections/1867-present.html>.
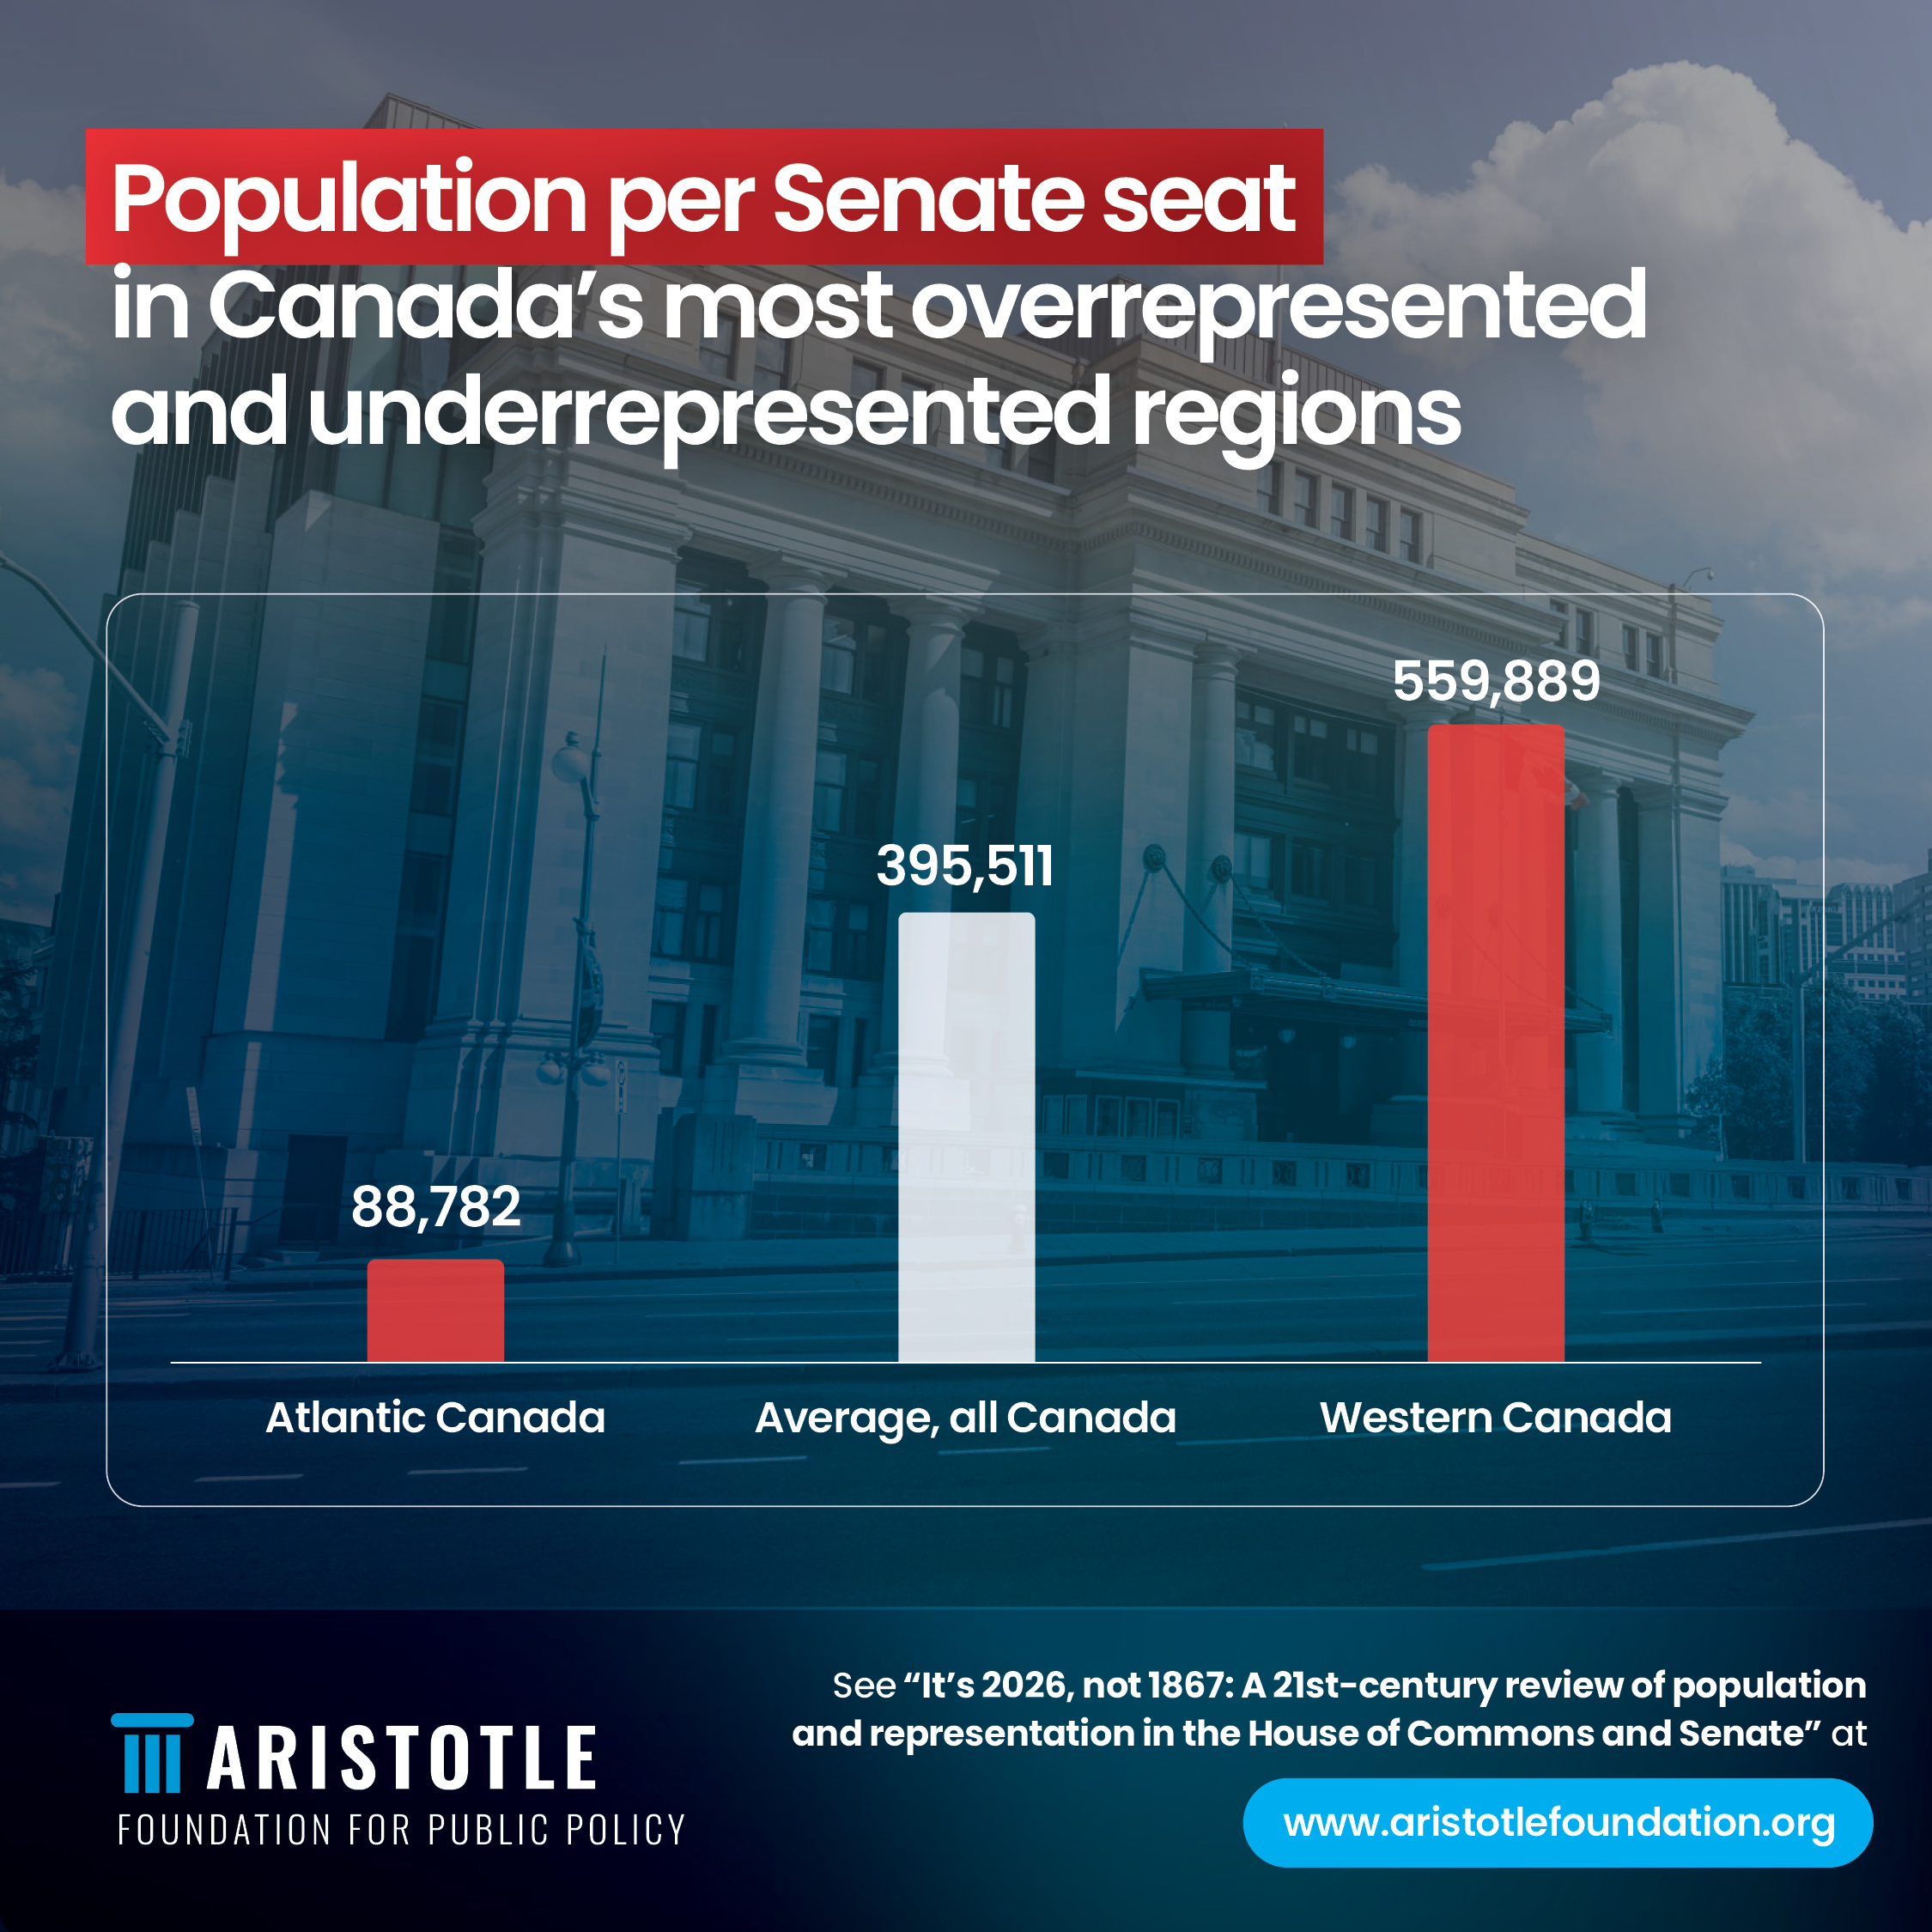
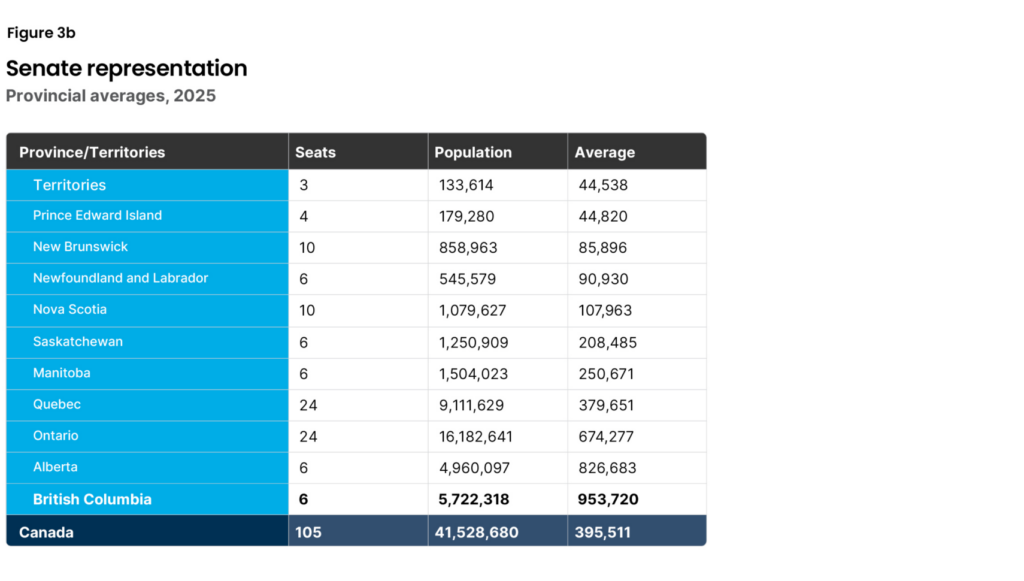
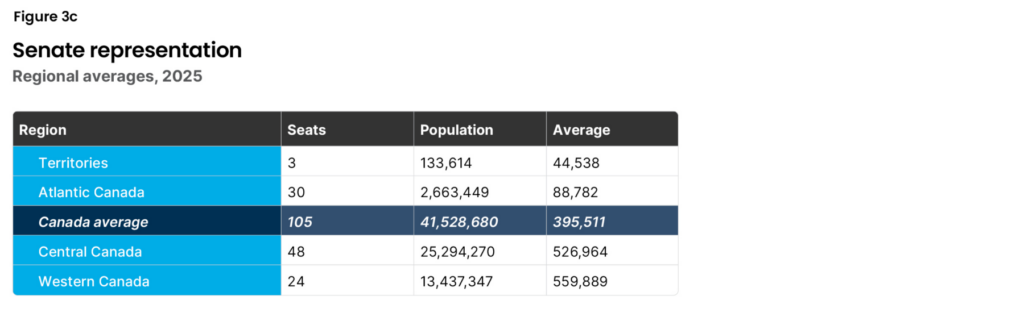
The Senate is wholly unrepresentative of the makeup of Canada’s provinces. In 2025, the most underrepresented province in the Senate was British Columbia, where one senator represents 953,720 people. In contrast, Quebec has a senator for every 379,651 people, and each Prince Edward Island senator represents just 44,820 people (Figure 3b). The regional breakdown also illustrates the imbalance. Regionally, Western Canada and Central Canada are closer in per-seat representation, while a stark divergence and advantage yet exists for Atlantic Canada (Figure 3c). The “Central Canada” and “Western Canada” division, though, both suffer from this flaw: it is not at all clear that Quebecois and Ontarians have aligned interests and concerns any more than Manitobans and British Columbians may have similar priorities. Arguably, provincial representation in the Senate is of more relevance to residents of each province than a regional comparison.
Sources: Authors’ calculations from Parliament of Canada (n.d.), “Senators,” Parliament of Canada <https://learn.parl.ca/understanding-comprendre/en/people-in-parliament/senators/>; Statistics Canada (2025), “Population estimates, quarterly—Table 17-10-0009-01,” Statistics Canada (December) <https://www150.statcan.gc.ca/t1/tbl1/en/tv.action?pid=1710000901>.
Sources: Authors’ calculations from Parliament of Canada (n.d.), “Senators,” Parliament of Canada <https://learn.parl.ca/understanding-comprendre/en/people-in-parliament/senators/>; Statistics Canada (2025), “Population estimates, quarterly—Table 17-10-0009-01,” Statistics Canada (December) <https://www150.statcan.gc.ca/t1/tbl1/en/tv.action?pid=1710000901>.
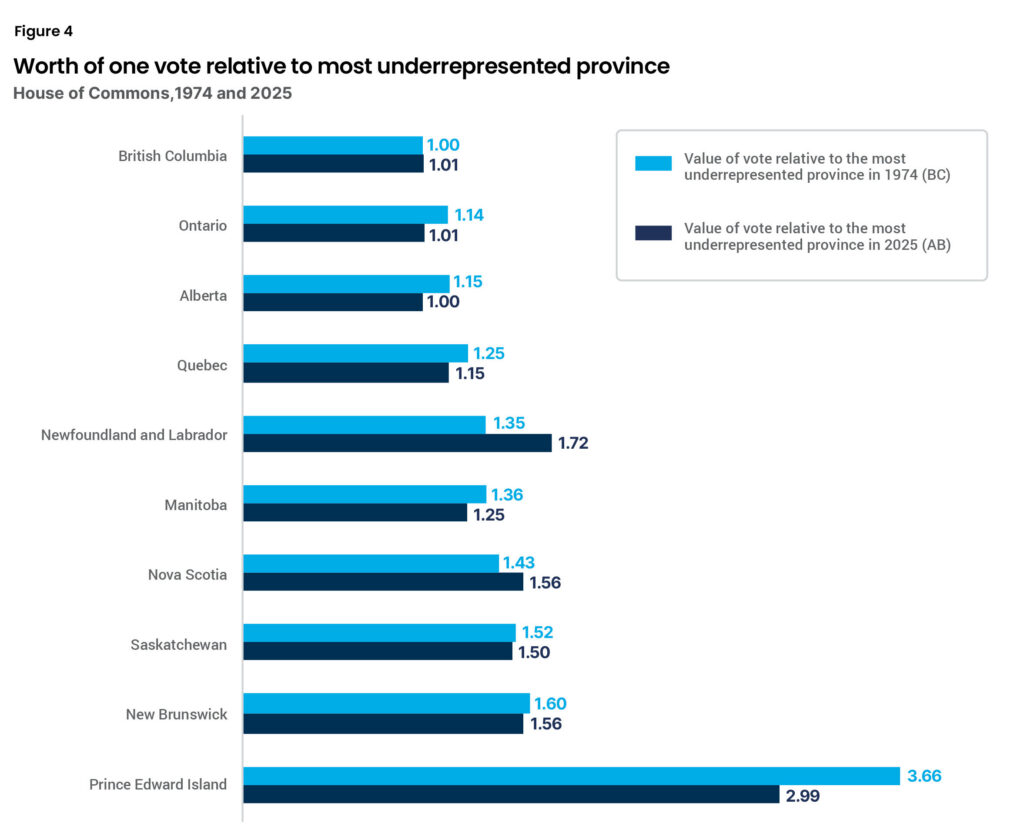
Another way to capture the underrepresentation is to examine the relative worth of a vote in 1974 and in 2025, by province, and relative to the most underrepresented province in the House of Commons.g In 1974, a vote in PEI was worth 3.7 times that of a vote of British Columbia. Fifty-one years later, in 2025, a PEI vote was still worth over three times that of the most underrepresented province; albeit, in 2025, Alberta had replaced British Columbia in that category (Figure 4).
g For the purposes of straightforward comparisons, we assume an equal proportion of voters in each province will vote on election day, thus using population by province divided by House of Commons seats, as a proxy. A more exact figure would also depend on proportional turnout, i.e., if one province has higher or lower turnout relative to another and/or has a lower or higher proportion of a voting-age population relative to another.
Sources: Authors’ calculations from Parliament of Canada (n.d.), “Senators,” Parliament of Canada <https://learn.parl.ca/understanding-comprendre/en/people-in-parliament/senators/>; Statistics Canada (2025), “Population estimates, quarterly—Table 17-10-0009-01,” Statistics Canada (December) <https://www150.statcan.gc.ca/t1/tbl1/en/tv.action?pid=1710000901>.
If Canadians in 2026 desire to have Canadian democracy reflect current realities, we offer a calculation to that end. We note that not all proposed remedies will please everyone in all provinces including in Western provinces. Our analysis is best described as a “clarity calculation.”
We are aware that our recommendations involve legal and constitutional changes.
However, absent substantial reforms of the kind proposed here, Canadians may find separatist sentiment spiking in Western Canada for reasons connected to economic and political frustrations (federal transfer payments, blocked resource projects) as well as chronic underrepresentation. Those economic and political realities are in stark contrast with those of Quebec, a net recipient, and chronically overrepresented in Canada’s institutions. Also, separatist sentiment is potentially more attractive to some in a wealthy province than in a poorer province precisely because a voter may feel the risk is less in the former (Alberta) than in the latter (Quebec).
It is thus critical to make the case for reforms should separatist sentiment in Quebec exacerbate tensions within Confederation and concurrently drive separatist sentiment higher in the West.10 It is instructive to recall that British Columbians opposed a package of constitutional amendments, the Charlottetown Accord, in a 1992 referendum in greater proportion (68.3%) than did Albertans (60.2%) or Quebecois (56.7%).11 Part of the opposition in British Columbia and in other provinces was driven by proposals for special status for Quebec. As one academic noted in a post-mortem on the Charlottetown Accord referendum, “Citizens in provinces outside of Quebec resented being told that a deal had to be reached or Quebec would separate and the Canadian economy would be destabilized…. The public residing outside of Quebec also questioned the “Yes” side’s argument that the deal was necessary to redress Quebec’s grievances.”12
One part of our rationale for change is exactly that continued imbalances in representation will exacerbate Western alienation and feed potential separatist sentiment in Western Canada. Another part of the rationale for change is that the principle of representation by population is critically necessary for legitimacy in a democracy and Canadians deserve a House of Commons that reflects 21st-century realities, not those of 1867 or even 1982.
One partial remedy to selected Western discontent is to expand the House of Commons to 350 seats but with a permanent cap at that number and regular, strict redistribution by population. We note that while voters will be treated equally as a result of such reforms, not every province will benefit and some will lose MPs, including two Western provinces: Saskatchewan and Manitoba. In addition to being closer to the one-person, one-vote ideal of democracies and ensuring that votes are more equal across Canada, this reform would benefit not only BC and Alberta but Ontario as well. That is to be expected given the current underrepresentation in those three provinces.13
In our analysis, we examined parliamentary representation by province and by region since 1974.h We calculated the population per province in 2025 and matched it up to the existing number of MPs and then calculated a “what if?” scenario. We rounded up for seats to ensure no province received fewer MPs than its population would warrant.i These rounded up calculations thus necessitated an extra seven MPs across Canada, above the existing 343, for a total of 350 constituencies.
A note: one could choose a higher number of MPs in order to ensure that no province loses MPs and that representation by population can be achieved. However, we assume that a House of Commons with hundreds more constituencies in addition to the 343 constituencies at present, or 350 constituencies in our scenario, would be seen as excessive by some Canadians. But it would solve both problems.
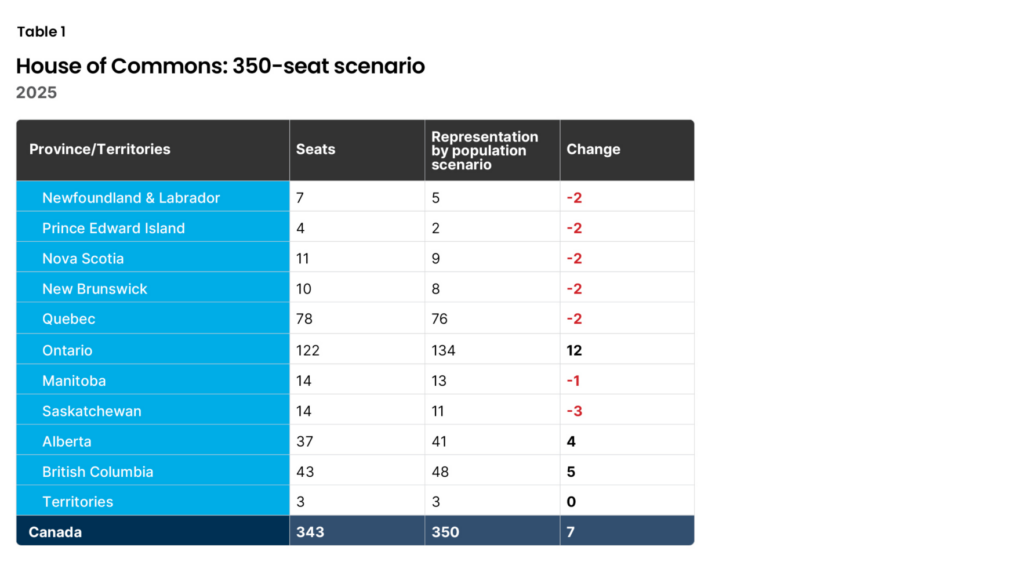
In our 350-seat scenario, the overall results are as follows: if voters in every province elected MPs according to population, and with the stipulation that the number of MPs per province was not less than the province’s population proportion of Canada, Canadians would have elected 350 MPs in 2025 with more representation in Ontario (+12), British Columbia (+5), and Alberta (+4).
h We have chosen to not include territorial calculations in any revised parliamentary representation given the vast nature of the three territories. We are aware that remote areas within provinces could make the case that vast distances also warrant a lower population-per-riding count in selected ridings. One remedy to that in-province is to proceed with strict representation-by-population reform for the provinces but allow each province to rebalance internally, i.e., to carve out ridings in each province that allow for lower population counts per remote riding, which means urban ridings would have slightly higher counts. This would have the virtue of allowing each province to be fully represented in Parliament and allow for local riding population differentials. It would not harm the standing and representation of other provinces in Parliament.
i For example, in the case of Atlantic Canada, the calculations led to the following non-rounded results: Newfoundland & Labrador (4.51), Prince Edward Island (1.48), Nova Scotia (8.92), and New Brunswick (7.09). To avoid underrepresentation by population, we rounded up to 5, 2, 9, and 8 seats respectively. Similarly, with Quebec, representation by population resulted in 75.26 MPs for the province but we rounded the number up to 76.
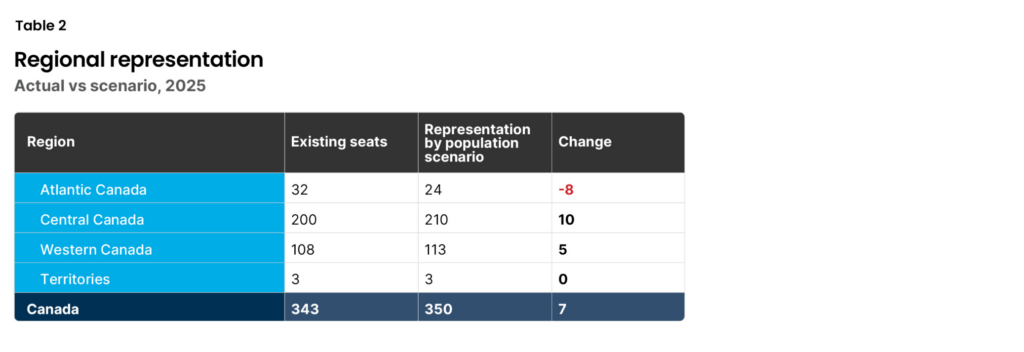
Together, those three provinces in a population-balanced House of Commons would have sent 223 MPs to Ottawa instead of 202. All other provinces would have sent fewer MPs to Parliament, with every Atlantic province and Quebec losing two MPs each, Saskatchewan losing three, and Manitoba one (Table 1). Regional representation would shift. Atlantic Canada would lose eight MPs, Central Canada would gain ten MPs, and Western Canada would gain five MPs (Table 2).
Expressed another way, at present and in a calculation for a 350-seat House of Commons, without any change in representation:
In an expanded 350-seat House of Commons with seven more seats and with a closer adherence to representation by population, Ontario, British Columbia, and Alberta would have more power in the House of Commons: those provinces would gain 21 seats in total and all other provinces would lose 14 seats (Table 1).
Proposing that Atlantic Canada, Quebec, and two Prairie provinces lose representation in the House of Commons so that Ontario, British Columbia, and Alberta are properly represented in 21st-century Canada is not a mild reform. However, in a national and constitutional crisis—should separatism soar in one or more Western provinces or revitalize in Quebec—fairness in parliamentary representation should be on the negotiating table.
The proposed remedy and reform are not radical. Other parliamentary democracies such as the United Kingdom, Australia, and New Zealand all redistribute lower house seats.j Thus, it is not clear even in the absence of a constitutional crisis and negotiations, why three of Canada’s most populous provinces should accept underrepresentation as a permanent state of affairs.
One response to our proposed reform is that in an ethnolinguistically divided country, the political compromise that allows for a significant variation in seat “size” helps avoid a potentially explosive division that strict representation by population might foment: the obvious minority, the Quebecois, was large enough in population to threaten Canada’s existence at the time of Confederation and also now. Also, small provinces naturally fear being dominated by larger provinces. David E. Smith, among others, have written about just this dynamic.14
Another view comes from Janet Ajzenstat who has argued that both the Senate and the House of Commons were envisioned to be national in scope and not represent regional or provincial interests.
j New Zealand’s geographic-based ridings, not its proportional representation ridings.
Neither the Senate nor the Commons was intended to bring into the national legislature substantive matters that were exclusive to one province or region. Thus: French-speaking senators would not introduce matters of importance to French Canadians alone….15
The Senate was intended to be an arena of national deliberation on the matters that affect everyone in the country equally, and was expected to use its status as an arena of national deliberation to resist attempts by the House of Commons to trespass on the rights of the political opposition and the rights of the provinces. But Canadians no longer understand the Fathers’ prescription. The time has come for reform.16
Both the Smith and Ajzenstat analyses are useful to ponder in terms of potential 21st-century reforms. The “smaller province” assertion along with the presumed national focus of the House of Commons and the Senate should be accompanied by an analysis of the historical realities of 1867, 1871, and 1873, and tracing population differences since then. The province of British Columbia, which was small at the time, joined Confederation in 1871, with Prince Edward Island joining in 1873. The treatment of both in terms of Senate seats was distinctly different with the smaller province—British Columbia—given some counterbalancing power in the Senate because of its low population. Of relevance, Prince Edward Island possessed nearly three times the population of British Columbia in 1871: the populations were 94,021 and 36,247 respectively, making British Columbia the smaller province.17 At the time, an accommodation was made where British Columbia received three Senate seats in 1871. (Prince Edward Island received four in 1873.)
However, that compromise in favour of the then-smaller province (British Columbia) which had roughly one-third the population of Prince Edward Island has more than “flipped” in the years since 1871 and 1873. As of 2025, British Columbia’s population was 32 times that of Prince Edward Island. The “smaller-province” response in terms of non-strict representation by population for the Senate has some validity. There is, however, a stark difference between accommodation in 1873 when PEI was three times as populous as British Columbia, and 153 years later, when British Columbia has 32 times the population of PEI. In the last six decades (the focus of this analysis), British Columbia has been underrepresented in both the Senate and the House of Commons. Thus, that Senate imbalance and the near-impossibility of Senate reform strengthens the case for closer representation by population in the lower house, the House of Commons.
Another useful point to ponder is found in other writings of Ajzenstat as per the founding fathers: “minorities” are not permanent.18 In one era, the “minority” may be defined by language or culture; in another it may be skin colour; in yet another it may be economic: Marxists (versus a capitalist majority). The point of Confederation’s national institutions, though, is to address national issues (at least if Ajzenstat’s view is accepted). In the context of this paper, that should mean that enough representation exists in the House of Commons and Senate from across the nation to actually provoke a national-interest perspective. This can be provoked, in part, by assuring citizens that their province or region is not underrepresented in both chambers.
The following thus offers rationales for rebalancing the House of Commons.
The first reason is basic electoral fairness. As noted previously, currently, a vote cast in Prince Edward Island is worth three times the vote cast in Alberta in terms of parliamentary representation, while a vote cast in Quebec is worth 1.1 times that of an Albertan. It may be argued that given the small number of seats in PEI (four) or the apparent slight imbalance for Quebec (1.1) this imbalance should be of little cause for concern.
The reality is that whether a small number of MPs such as in PEI or a much larger number in Quebec, those imbalances add up, and to the detriment of proper representation in Ontario, BC, and Alberta. In our scenario, where seven additional MPs are added in order to ensure no province is underrepresented given its population, those three provinces are short 21 MPs without such rebalancing in a 350-seat Parliament.
A second reason why parliamentary seats should be redistributed with a stricter adherence to population—despite the political and constitutional wrangling that it will necessarily entail—is because the Senate, which, in theory, is meant to balance out regional interests, is virtually unreformable due to a 2014 Supreme Court of Canada decision.19
The near-unreformable Senate thus makes the case for lower-house reform even stronger. In Australia, the United Kingdom, and New Zealand, the lower houses (equivalent to Canada’s House of Commons) are closer to actual representation by population. Upper houses, where they exist,k are regionally balanced to deliberately counteract the population disparities. However, this mix does not exist in Canada. In Canada, neither the House of Commons nor the Senate is representative of population realities. Western Canada is thus disadvantaged in both the House of Commons and the Senate. In the other Anglosphere nation-states surveyed, a province, state, or region is normally disadvantaged in only one house.
In Canada, a significant imbalance exists in House of Commons representation between the provinces, as noted earlier. This is due to constitutional and legal provisions that guarantee ongoing inequality between the provinces despite population shifts over time.20 While population is initially taken into account in the number of ridings that exist in Canada, with some rebalancing every ten years along with additional seats added to the House of Commons, provisions including the “Senatorial Clause” (no province shall have fewer MPs than it has senators) and the “Grandfather Clause” (no province may have fewer MPs than in 2019) lead to chronic underrepresentation in the House of Commons for Alberta, British Columbia, and Ontario.
k New Zealand has no upper house. The Legislative Council as it was known, the equivalent of the British House of Lords or the Canadian Senate, was abolished in 1951.
Given that state of imbalance, the third reason for rebalancing is the fact that lower house rebalancing does occur in other parliamentary systems such as the United Kingdom, Australia, and New Zealand.l
The makeup of seats in the British House of Commons is related in part to changesm in what constitutes the United Kingdom.21 In 2010, the number of MPs was increased to 650, the current number.22
The number of seats in the House of Commons is allocated regionally according to population, with ridings added in certain regions and removed from others. Importantly, and of relevance for Canada, no region is guaranteed a minimum number of seats. The maximum divergence permitted from the average constituency population is 5 percent, with only five island seats exempt from the “5% Rule,” akin to Canada’s territories.23
For example, in response to a 2023 review of Westminster constituencies in the United Kingdom, which became effective for the 2024 election, England gained 10 constituencies, Northern Ireland’s seat count stayed the same, Scotland lost two constituencies, and Wales lost eight constituencies (Table 3).24 The United Kingdom’s House of Commons Library notes the 2024 reform ended the “over-representation of Wales 25 years after devolution.”25
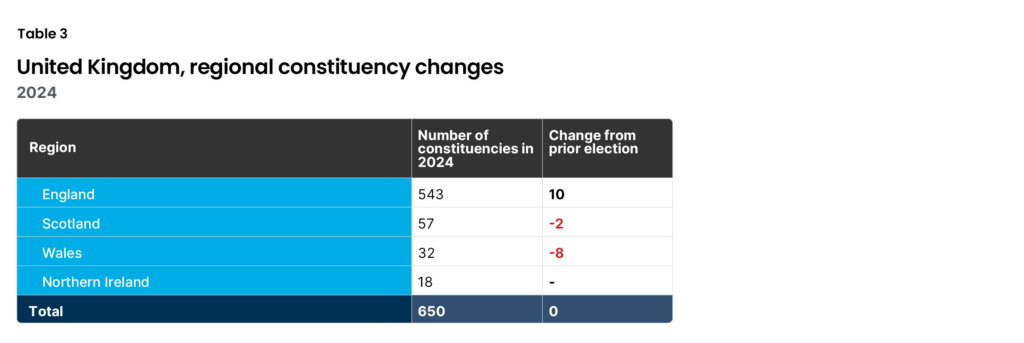
Source: Philip Gorman, Anya Somerville, and Sarah Priddy (2024), “Number of seats in the House of Commons since 1801,” House of Commons Library, UK Parliament (July 30) <https://commonslibrary.parliament.uk/research-briefings/sn02384/>.
l New Zealand’s geographic-based ridings, not its proportional representation ridings.
m The United Kingdom comprises England, Scotland, Wales, and Northern Ireland. Historically, that included the independence of Ireland proper from Great Britain in 1922. The number of seats in the House of Commons in the 20th century thus fluctuated from 707 (pre-Irish independence) to 615 (post-independence). Since then, population growth led to an increase in the number of British constituencies from 625 in 1950 to 659 by 1997 and until 2005. In that year, with the establishment of a parliament for Scotland, the number of MPs in the British House of Commons was reduced to 646.
The number of constituencies in Australia’s House of Representatives (its lower house) stands at 151 Members, while the upper house, the Senate, has 76 senators.26 There is no cap on the number of representatives or senators, though the number of representatives is, by law, meant to be at least twice the number of senators as is practicable.
Each Australian staten has twelve senators, irrespective of its population. Four additional senators exist with two representing the Northern Territory and two representing the Australian Capital Territory. The House of Representatives is composed of constituencies mostly determined by population, with limited exceptions.27 The Australian Electoral Commission (AEC) administers the process and notes that “a population-based formula determines the number of seats [to which] each state and territory is entitled.”28 When redistribution occurs, newly-created constituencies must not diverge from the average “enrolment” (relevant population) of their states or territories by more than 10 percent and more than 3.5 percent from the state or territory for projected future population growth.29
States and territories can be rebalanced in the House of Representatives for relative population declines or increases.30 After the 2016 election, South Australia lost one House of Representatives member in redistribution while Victoria and the Australian Capital Territory each gained one riding. The overall number of constituencies in the House of Representatives increased to 151 from 150.31
New Zealand’s Legislative Council (akin to the British House of Lords or the Canadian Senate) was abolished in 1951.32 The country retained only its lower house, the House of Representatives. After 1996 reforms, where a partial proportional representation system came into effect, New Zealand’s House of Representatives has been a mixture of geographic-based constituencies and seats allocated to parties based roughly on their share of the popular vote. New Zealand’s House of Representatives consists of 72 members elected by a plurality of the vote in 65 geographic-based constituencies, 48 members allocated a “seat” based on the proportional representation system, and seven Māori members from Māori constituencies.33
n Australia has six states—New South Wales, Victoria, Queensland, Western Australia, South Australia, and Tasmania—and two internal territories—the Northern Territory and the Australian Capital Territory—which contain Canberra.
Based on 1993 legislation, New Zealand’s electoral boundaries are reviewed every five years in conjunction with population statistics. As New Zealand’s Electoral Commission notes:
Regularly adjusting the electorate boundaries makes sure each electorate has about the same number of people. This gives all New Zealanders equal representation in Parliament. The Representation Commission uses total populations to adjust boundaries, rather than just registered voters, because members of Parliament represent everyone living in their area, not just those who can register to vote.34
As of 2025, the Electoral Commission is proposing shifts in representation in New Zealand to account for shifting population proportions. For example, the North Island is forecast to lose one seat in part due to a faster growing region, Selwynd, on the South Island, with the total number of representatives to decrease by one.35
Political representation in Canada at present is not representative of the actual populations in each province. As even a review of the last six decades shows, the House of Commons has long overrepresented Quebec, the Atlantic provinces, Saskatchewan, and Manitoba at the expense of Ontario, British Columbia, and Alberta.
In a federal system where the regional upper body (the Senate, in Canada’s case) somewhat countered the underrepresentation in the lower body (the House of Commons), some marginal differences in the House of Commons might be excused. However, the Senate in Canada is even more unbalanced. Western Canada’s senators, for example, represent 6.3 times the number of people (559,889) than do Atlantic Canadian senators (88,782). British Columbia’s six senators represent 953,720 people, whereas Quebec’s 24 senators represent 379,651 people each. The numbers are even lower in Atlantic Canada where senators per population range from a high of 107,963 in Nova Scotia to a low of 44,820 in Prince Edward Island.
The near-unreformable Senate thus makes the case for lower-house reform even stronger. Other Anglosphere democracies such as the United Kingdom, New Zealand, and Australia hew closely to the principle of representation by population in their main elected national body. Such realities are not revolutionary.
This study is a fact-check on imbalances in the House of Commons in 2025. We have no illusions about the difficulties of changes to the House of Commons given constitutional and legal impediments as well as political self-interest. We do maintain that should Quebec and Western separatist sentiments rise, and should political and constitutional discussions and negotiations occur to reflect modern realities, all Canadians should start, at a minimum, with the facts of 2026 and not 1867.
Please see PDF for references.
Mark Milke, PhD, is the founder and president of the Aristotle Foundation for Public Policy. Mark is a public policy analyst and author with six books, over 70 studies, and more than 1,000 columns published in the last 25 years. He is the editor of the Aristotle Foundation’s first book, The 1867 Project: Why Canada Should Be Cherished–Not Cancelled. Mark is also the past president of the Sir Winston Churchill Society of Calgary where he drove ahead the commissioning, fundraising, and installation of a statue of Churchill in Calgary on June 6, 2024—the 80th anniversary of D-Day.
Ven Venkatachalam, PhD, is a senior economist at the Aristotle Foundation for Public Policy. With expertise in economic and fiscal policy, international relations, trade, energy, governance, immigration, education, tourism, and NGO matters, Venkatachalam has consulted for governments, NGOs, and private sector organizations across Asia, Europe, Canada, and the United States.
About the Aristotle Foundation for Public Policy
Who we are
The Aristotle Foundation for Public Policy is a new education and public policy think tank that aims to renew a civil, common-sense approach to public discourse and public policy in Canada.
Our vision
A Canada where the sacrifices and successes of past generations are cherished and built upon; where citizens value each other for their character and merit; and where open inquiry and free expression are prized as the best path to a flourishing future for all.
Our mission
We champion reason, democracy, and civilization so that all can participate in a free, flourishing Canada.
Our theory of change: Canada’s idea culture is critical
Ideas—what people believe—come first in any change for ill or good. We will challenge ideas and policies where they are in error, and buttress ideas anchored in reality and excellence.
Donations
The Aristotle Foundation for Public Policy is a registered Canadian charity and all donations will receive a tax receipt. To maintain our independence, we do not seek nor will we accept government funding. Donations can be made at www.aristotlefoundation.org.
The Aristotle Foundation for Public Policy has internal policies to ensure research is empirical, scholarly, ethical, rigorous, honest, and contributes to the advancement of knowledge and the creation, application, and refinement of knowledge about public policy. Our staff, research fellows, and scholars develop their research in collaboration with the Aristotle Foundation’s staff and research director. Fact sheets, studies, and indices are all peer-reviewed. Subject to critical peer review, authors are responsible for their work and conclusions. The conclusions and views of scholars do not necessarily reflect those of the Board of Directors, donors, or staff.