
The Aristotle Foundation recently commissioned Léger to survey 2,710 Canadians on their knowledge of parliamentary representation vis-à-vis their province. We also asked Canadians in every province about their thoughts on reforming the House of Commons and Senate—including having a more equal number of voters per riding—and their willingness to negotiate changes to federal transfer programs if separatist sentiments in the West and in Quebec rise.
This Reality Check accompanies the Léger survey to give Canadians the statistics about representation in the House of Commons and the Senate, as well as data about net fiscal transfers over time. We paraphrase some of the questions below.
This Reality Check can be read on its own but is intended to be read in parallel with the Léger survey. The contrast between what Canadians think, by province, about representation in the House of Commons and Senate as well as beliefs about provincial contributions to the federal treasury (and subsequent spending and transfers) is helpful to compare.
This Reality Check provides the data on actual numbers, proportions, and percentages. Readers should consult the survey overview in PDF form for the high-level results. The full Excel data set includes national, regional, and provincial responses and breakdowns to each question.
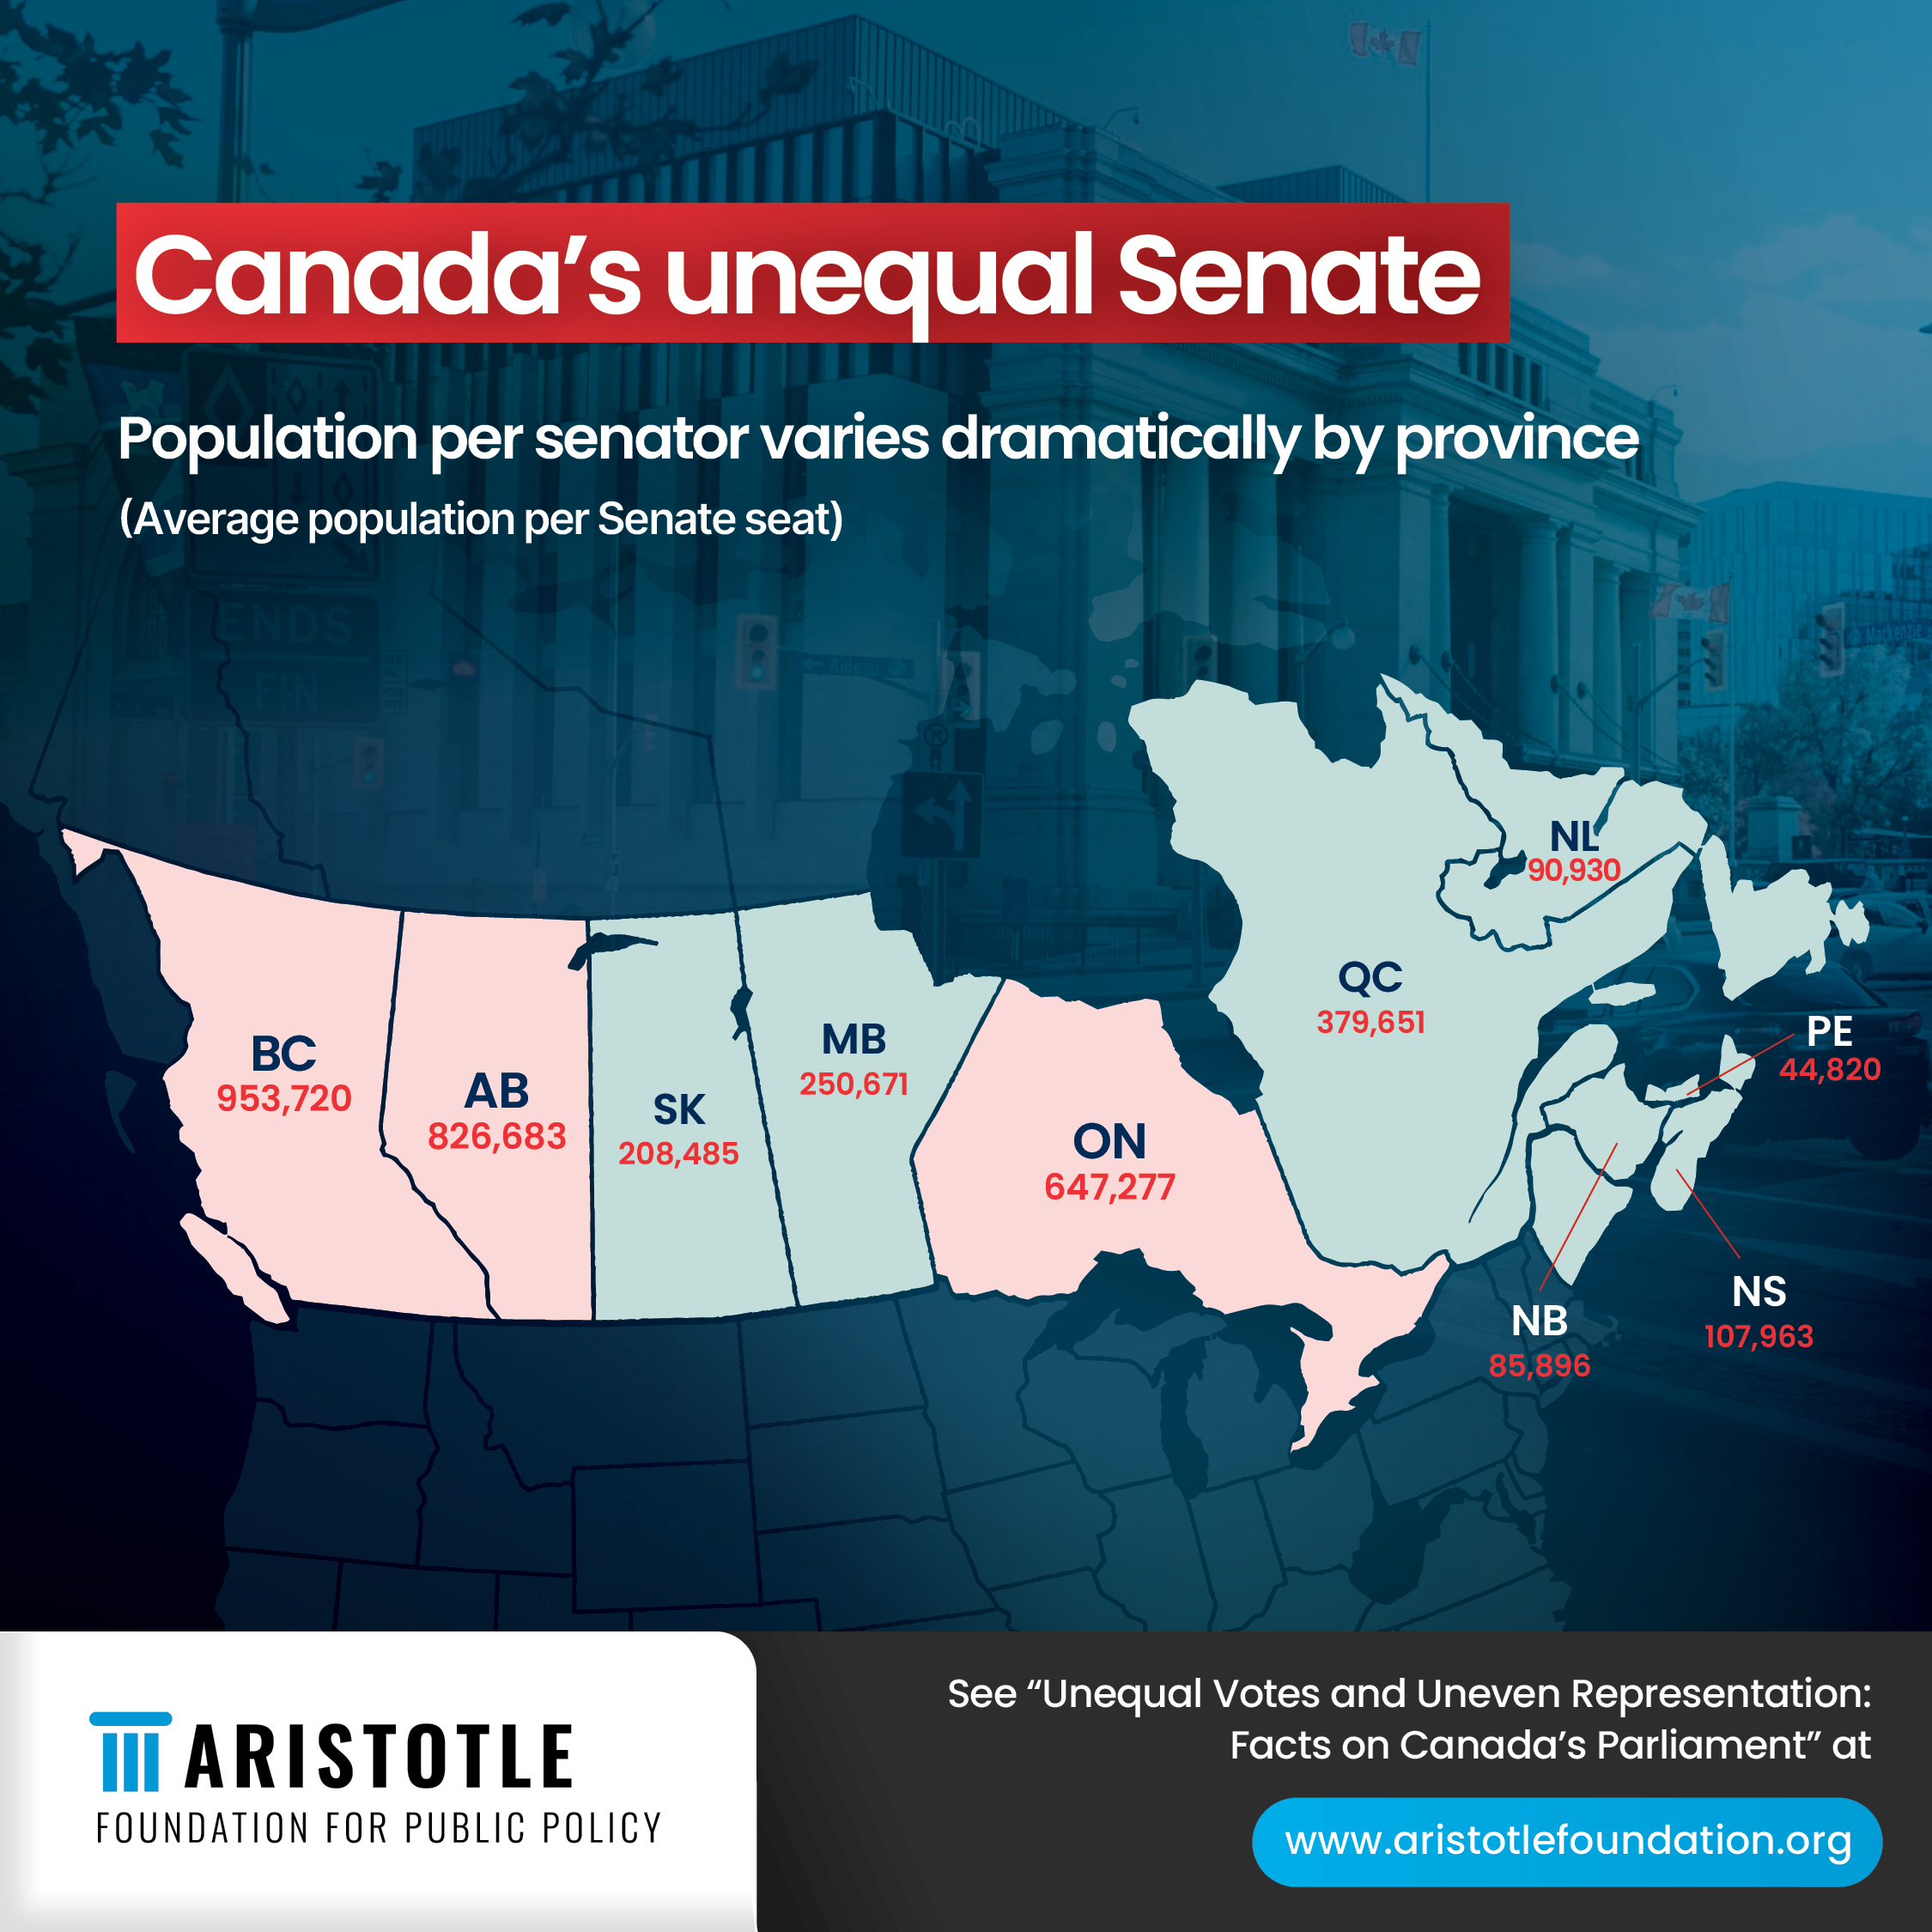
Questions 1 and 2: Representation in the House of Commons and Senate
Questions 1 and 2 ask Canadians if they think their province is under- or overrepresented in the House of Commons and the Senate. Western provinces and Atlantic Canadians were more likely to answer “underrepresented.”
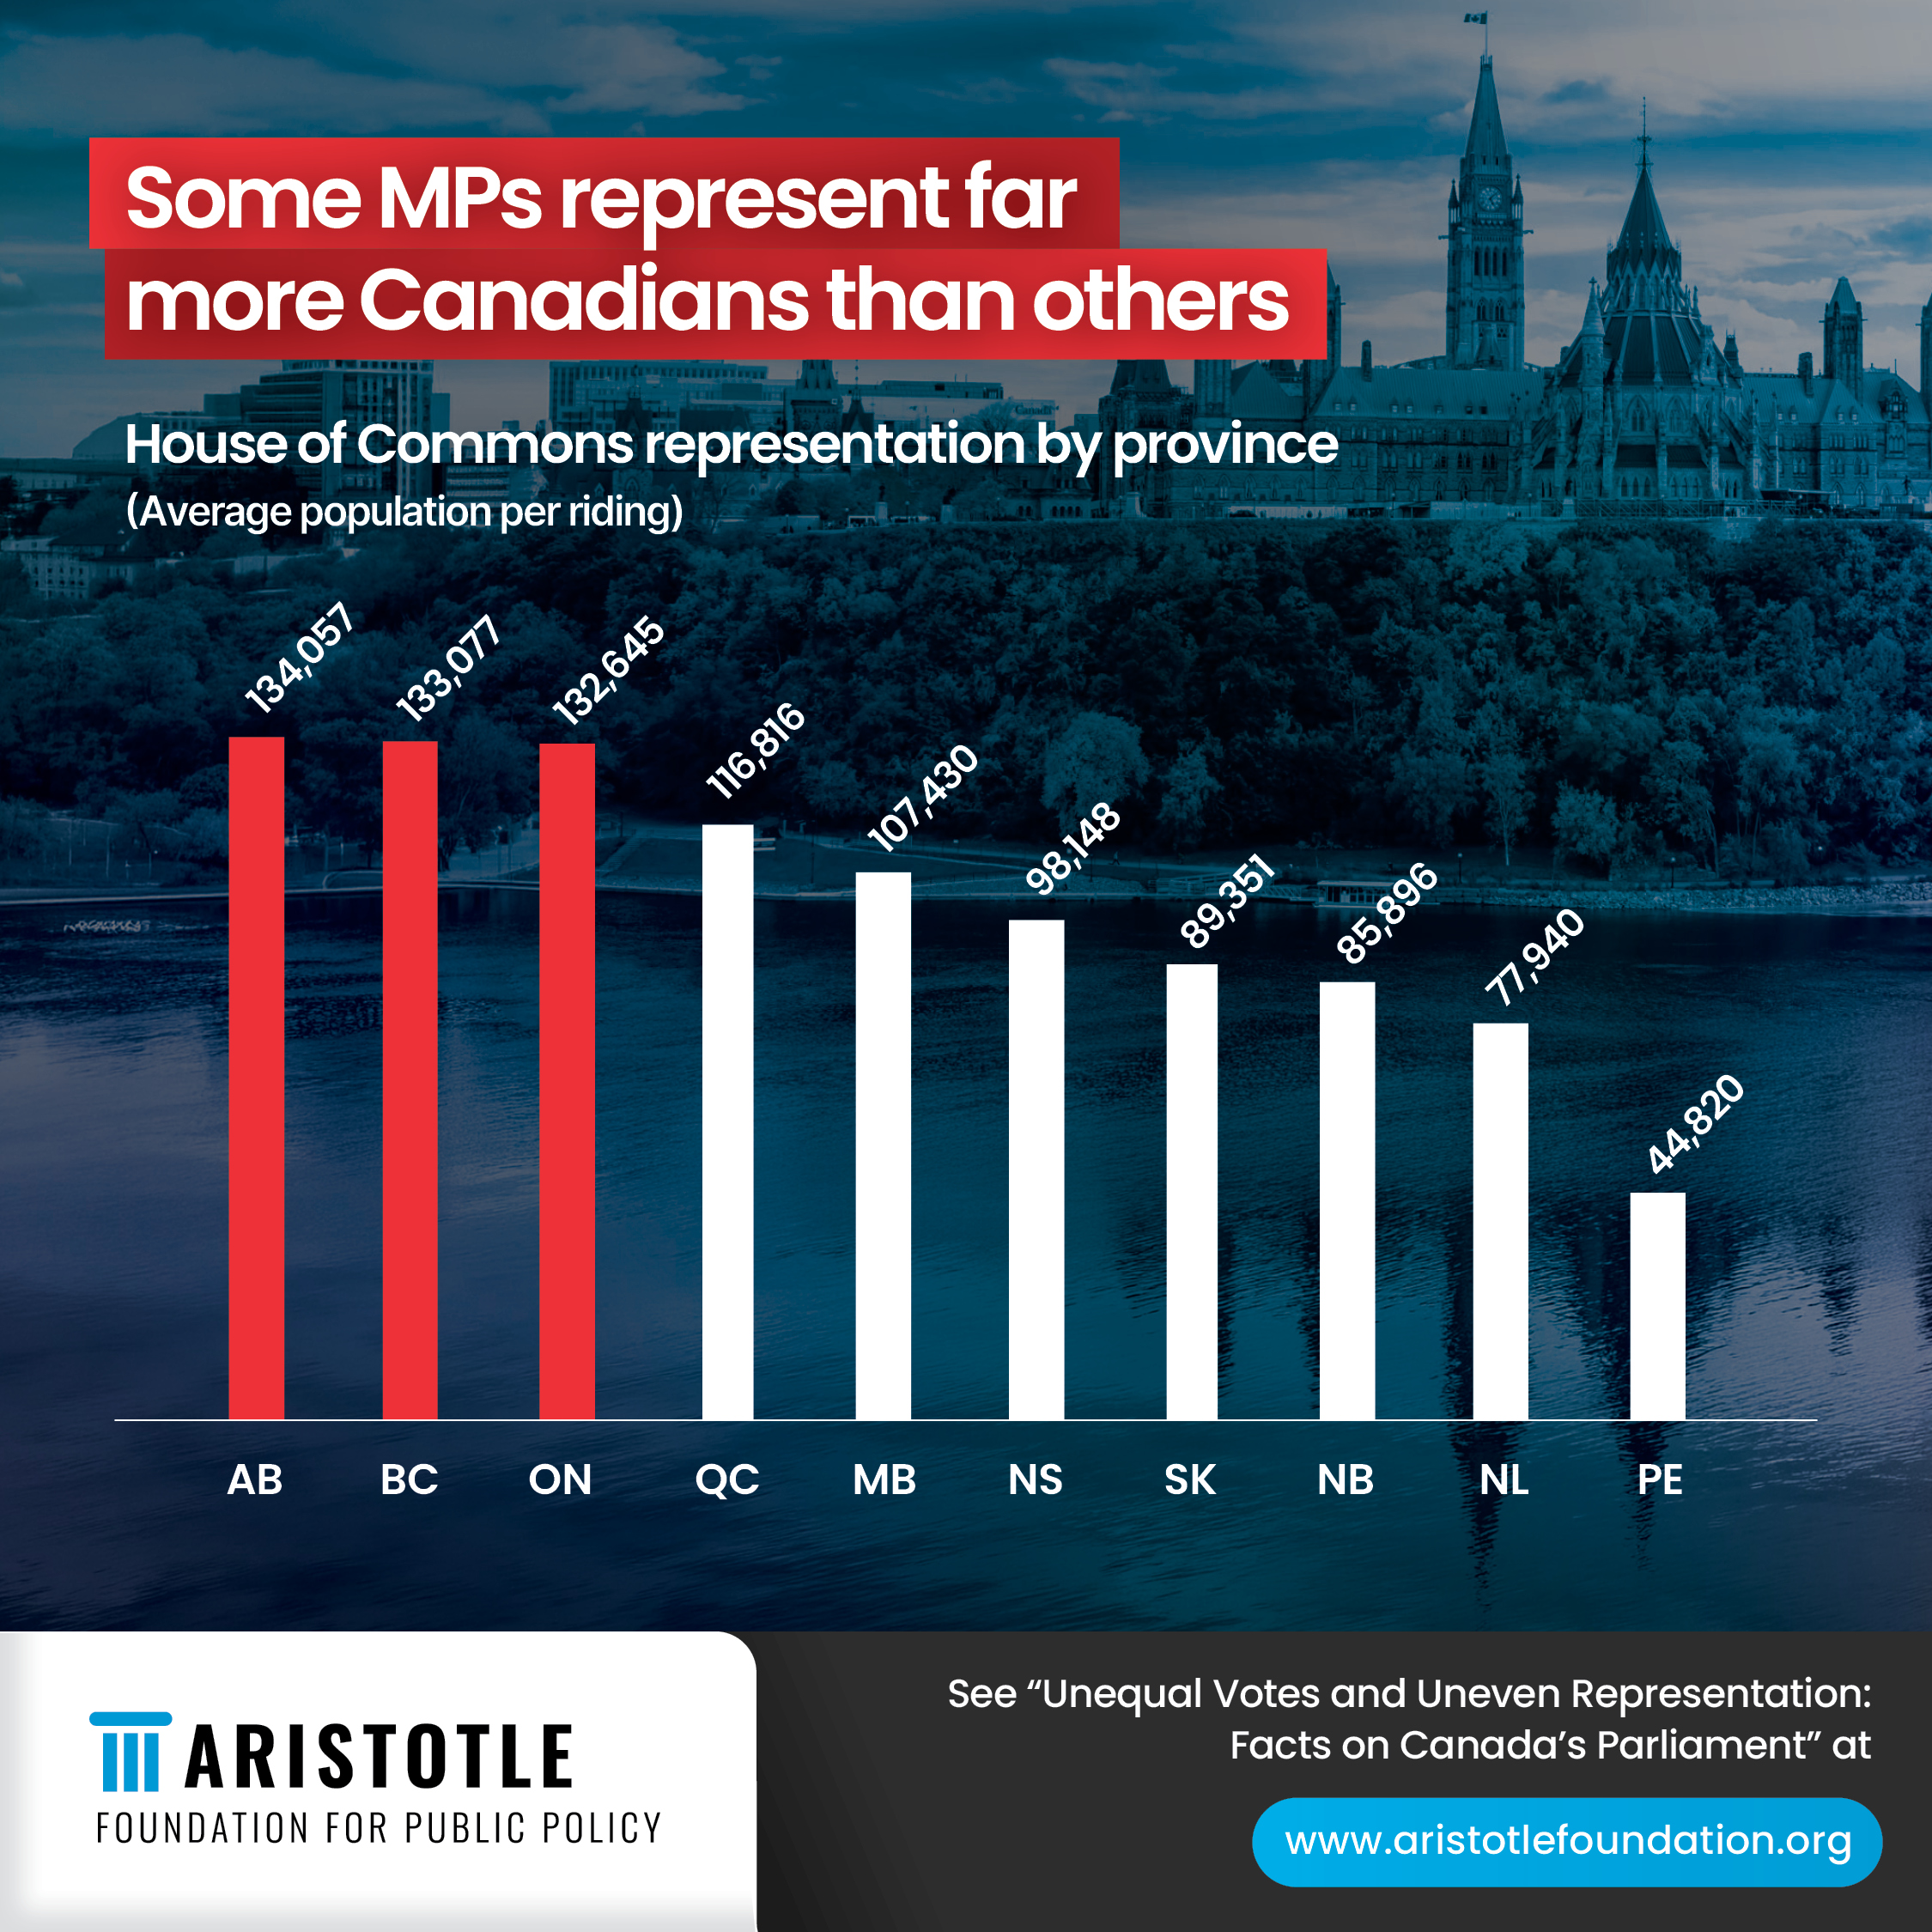
Question 9: Representation by population in the House of Commons
Question 9 asked whether respondents agree or disagree with the principle that all Members of Parliament should represent approximately the same number of people (i.e., that federal ridings across Canada should contain approximately the same number of people).
The net agreement ranged from 61% in Atlantic Canada to 73% in British Columbia, with the national percentage being 66%. Only 16% (13% somewhat and 3% strongly) disagreed.
Questions 10 and 11: Reforming the House of Commons and the Senate
Question 10 asked respondents about the ways in which they would like to see reform in the House of Commons to ensure closer representation by population. This question was based on the lower houses in Great Britain, New Zealand, and Australia, where ridings more closely represent about the same number of people.
Answers included:
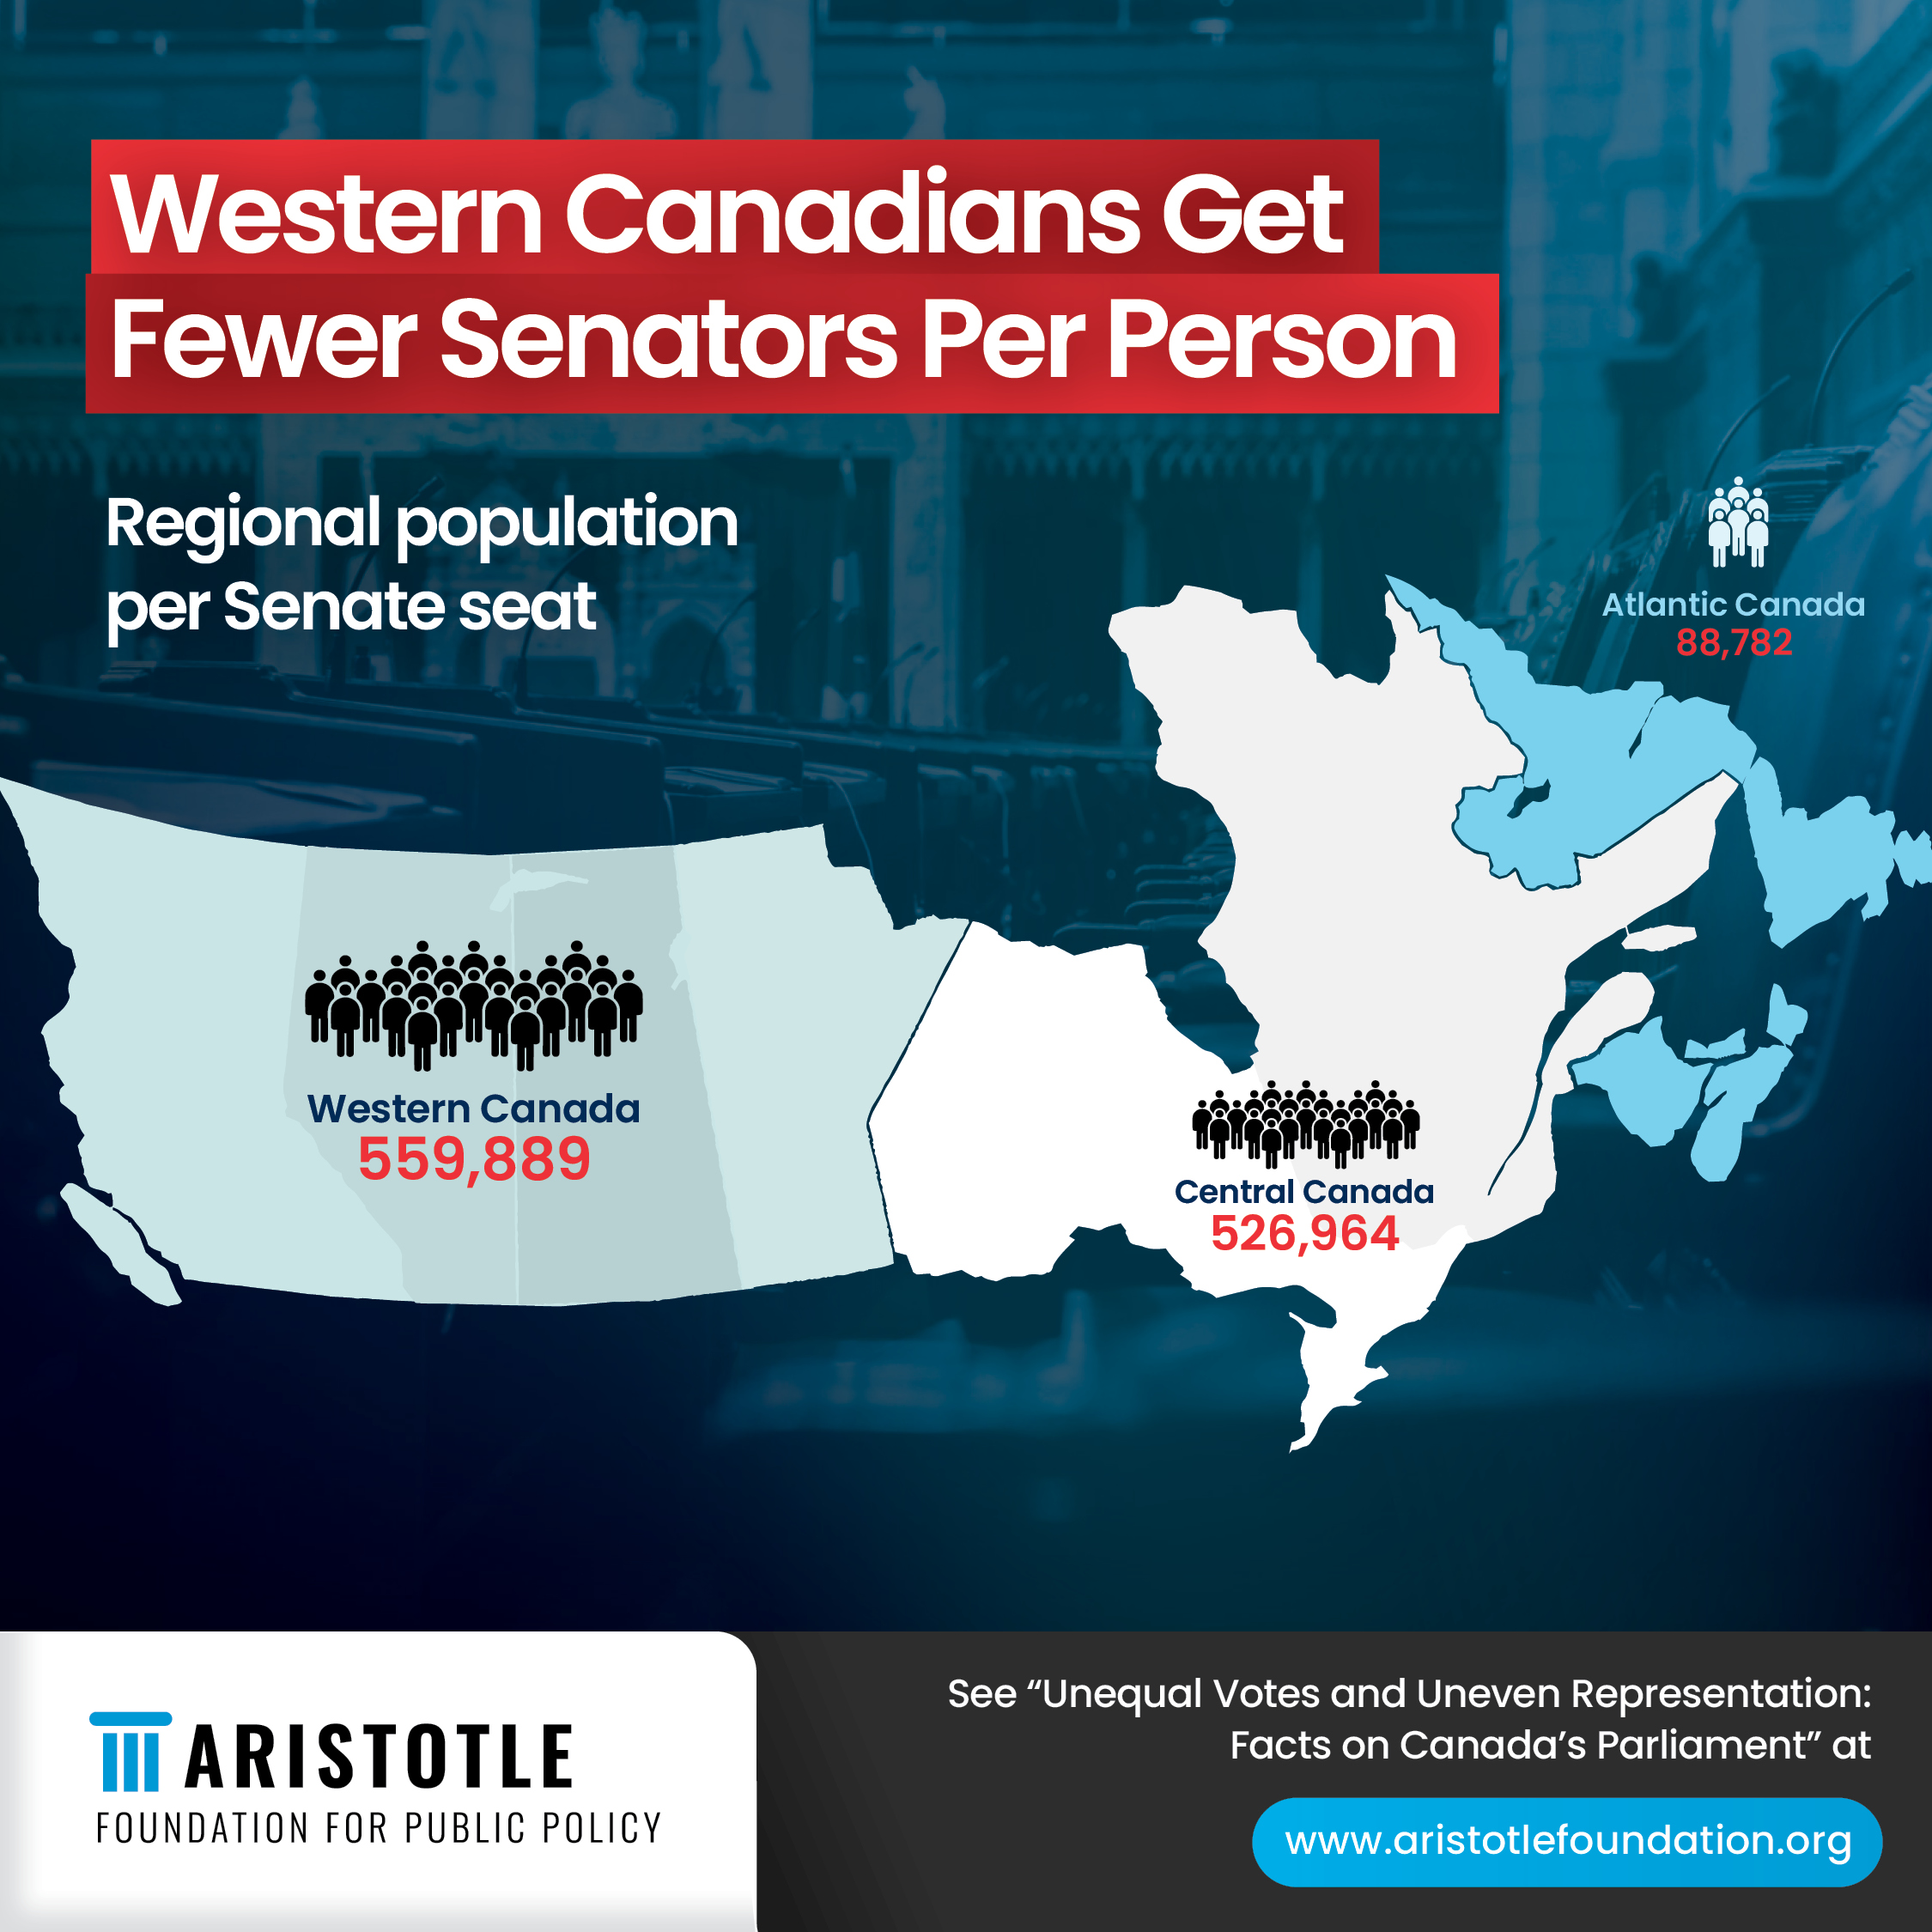
Question 11 asked if the Senate should be reformed to better reflect the actual population distribution across regions.
Answers included:
The data show that:
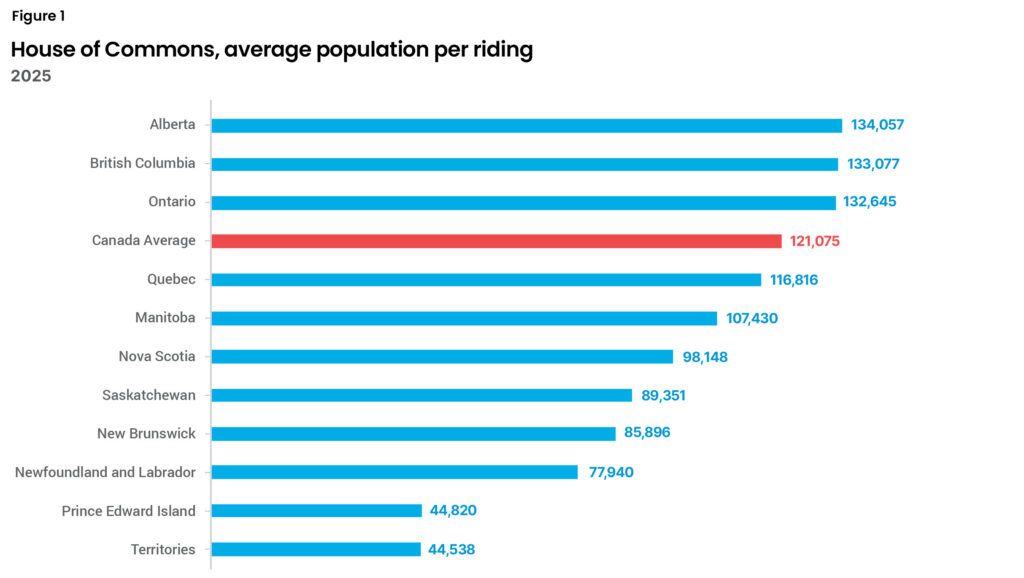
Source: Author’s calculation from Marc Bosc and André Gagnon (Eds.) (2017), “The House of Commons and Its Members” in House of Commons Procedure and Practice, Third edition (Éditions Yvon Blaise) <https://www.ourcommons.ca/procedure/procedure-and-practice-3/ch_04_1-e.html>; Statistics Canada (2025), “Population estimates, quarterly—Table 17-10-0009-01,” Statistics Canada (December) <https://www150.statcan.gc.ca/t1/tbl1/en/tv.action?pid=1710000901>.
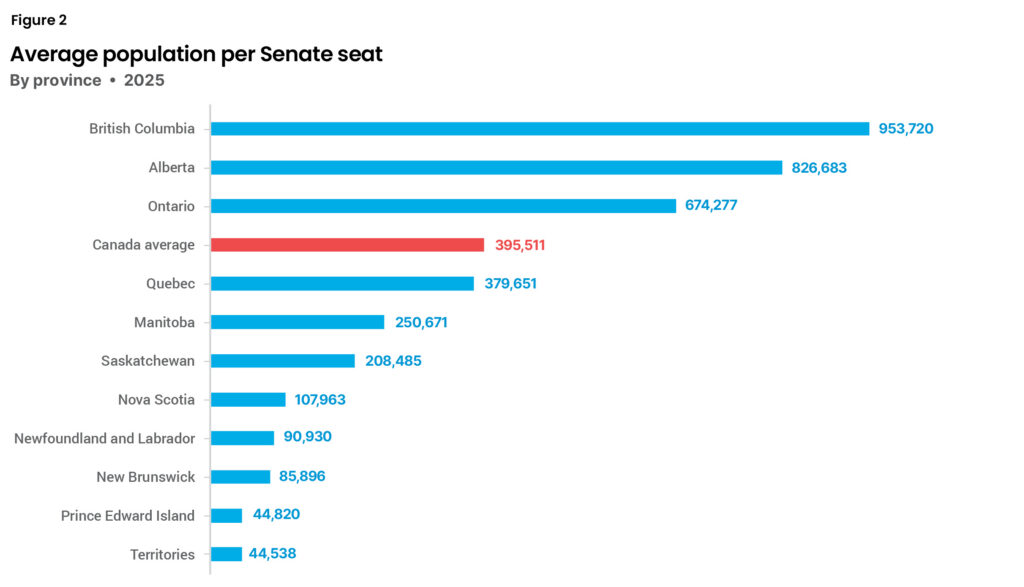
Source: Author’s calculation from Parliament of Canada (n.d.), “Senators,” Parliament of Canada <https://learn.parl.ca/understanding-comprendre/en/people-in-parliament/ senators/>; Statistics Canada (2025), Population estimates, quarterly—Table 17-10-0009-01,” Statistics Canada (December) <https://www150.statcan.gc.ca/t1/tbl1/en/tv.action?pid=1710000901>.
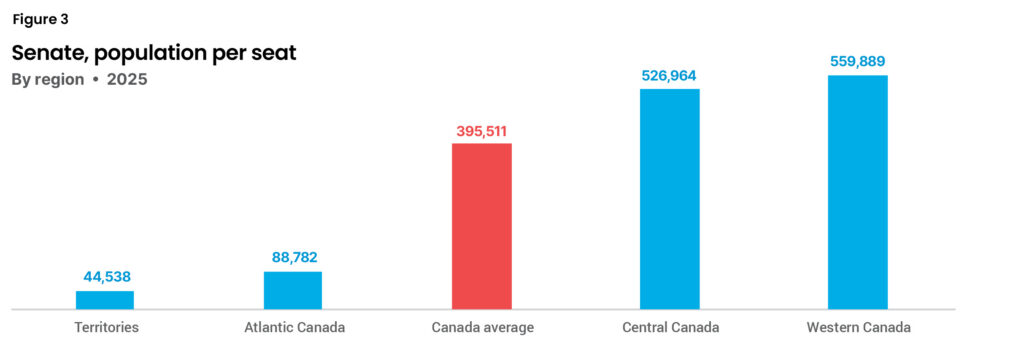
Source: Author’s calculation from Parliament of Canada (n.d.), “Senators,” Parliament of Canada <https://learn.parl.ca/understanding-comprendre/en/people-in-parliament/senators/>; Statistics Canada (2025), “Population estimates, quarterly—Table 17-10-0009-01,” Statistics Canada (December) <https://www150.statcan.gc.ca/t1/tbl1/en/tv.action?pid=1710000901>.
Question 3: Perceptions of provincial net contributions and benefits
Question 3 asked Canadians if they thought their province was a net contributor or a net recipient of federal taxation and spending. In other words, do taxpayers in their province pay more in federal taxes than their province and its residents receive “back” in federal spending (and in transfers to their provincial government)?
Questions 12 and 13: Support for federal transfer payment reform amid separatist tensions
Questions 12 and 13 asked Canadians about their willingness to reform federal transfer programs if Western or Quebec separatism flares up. In both cases, 43% were willing to reform the federal transfer payment program.
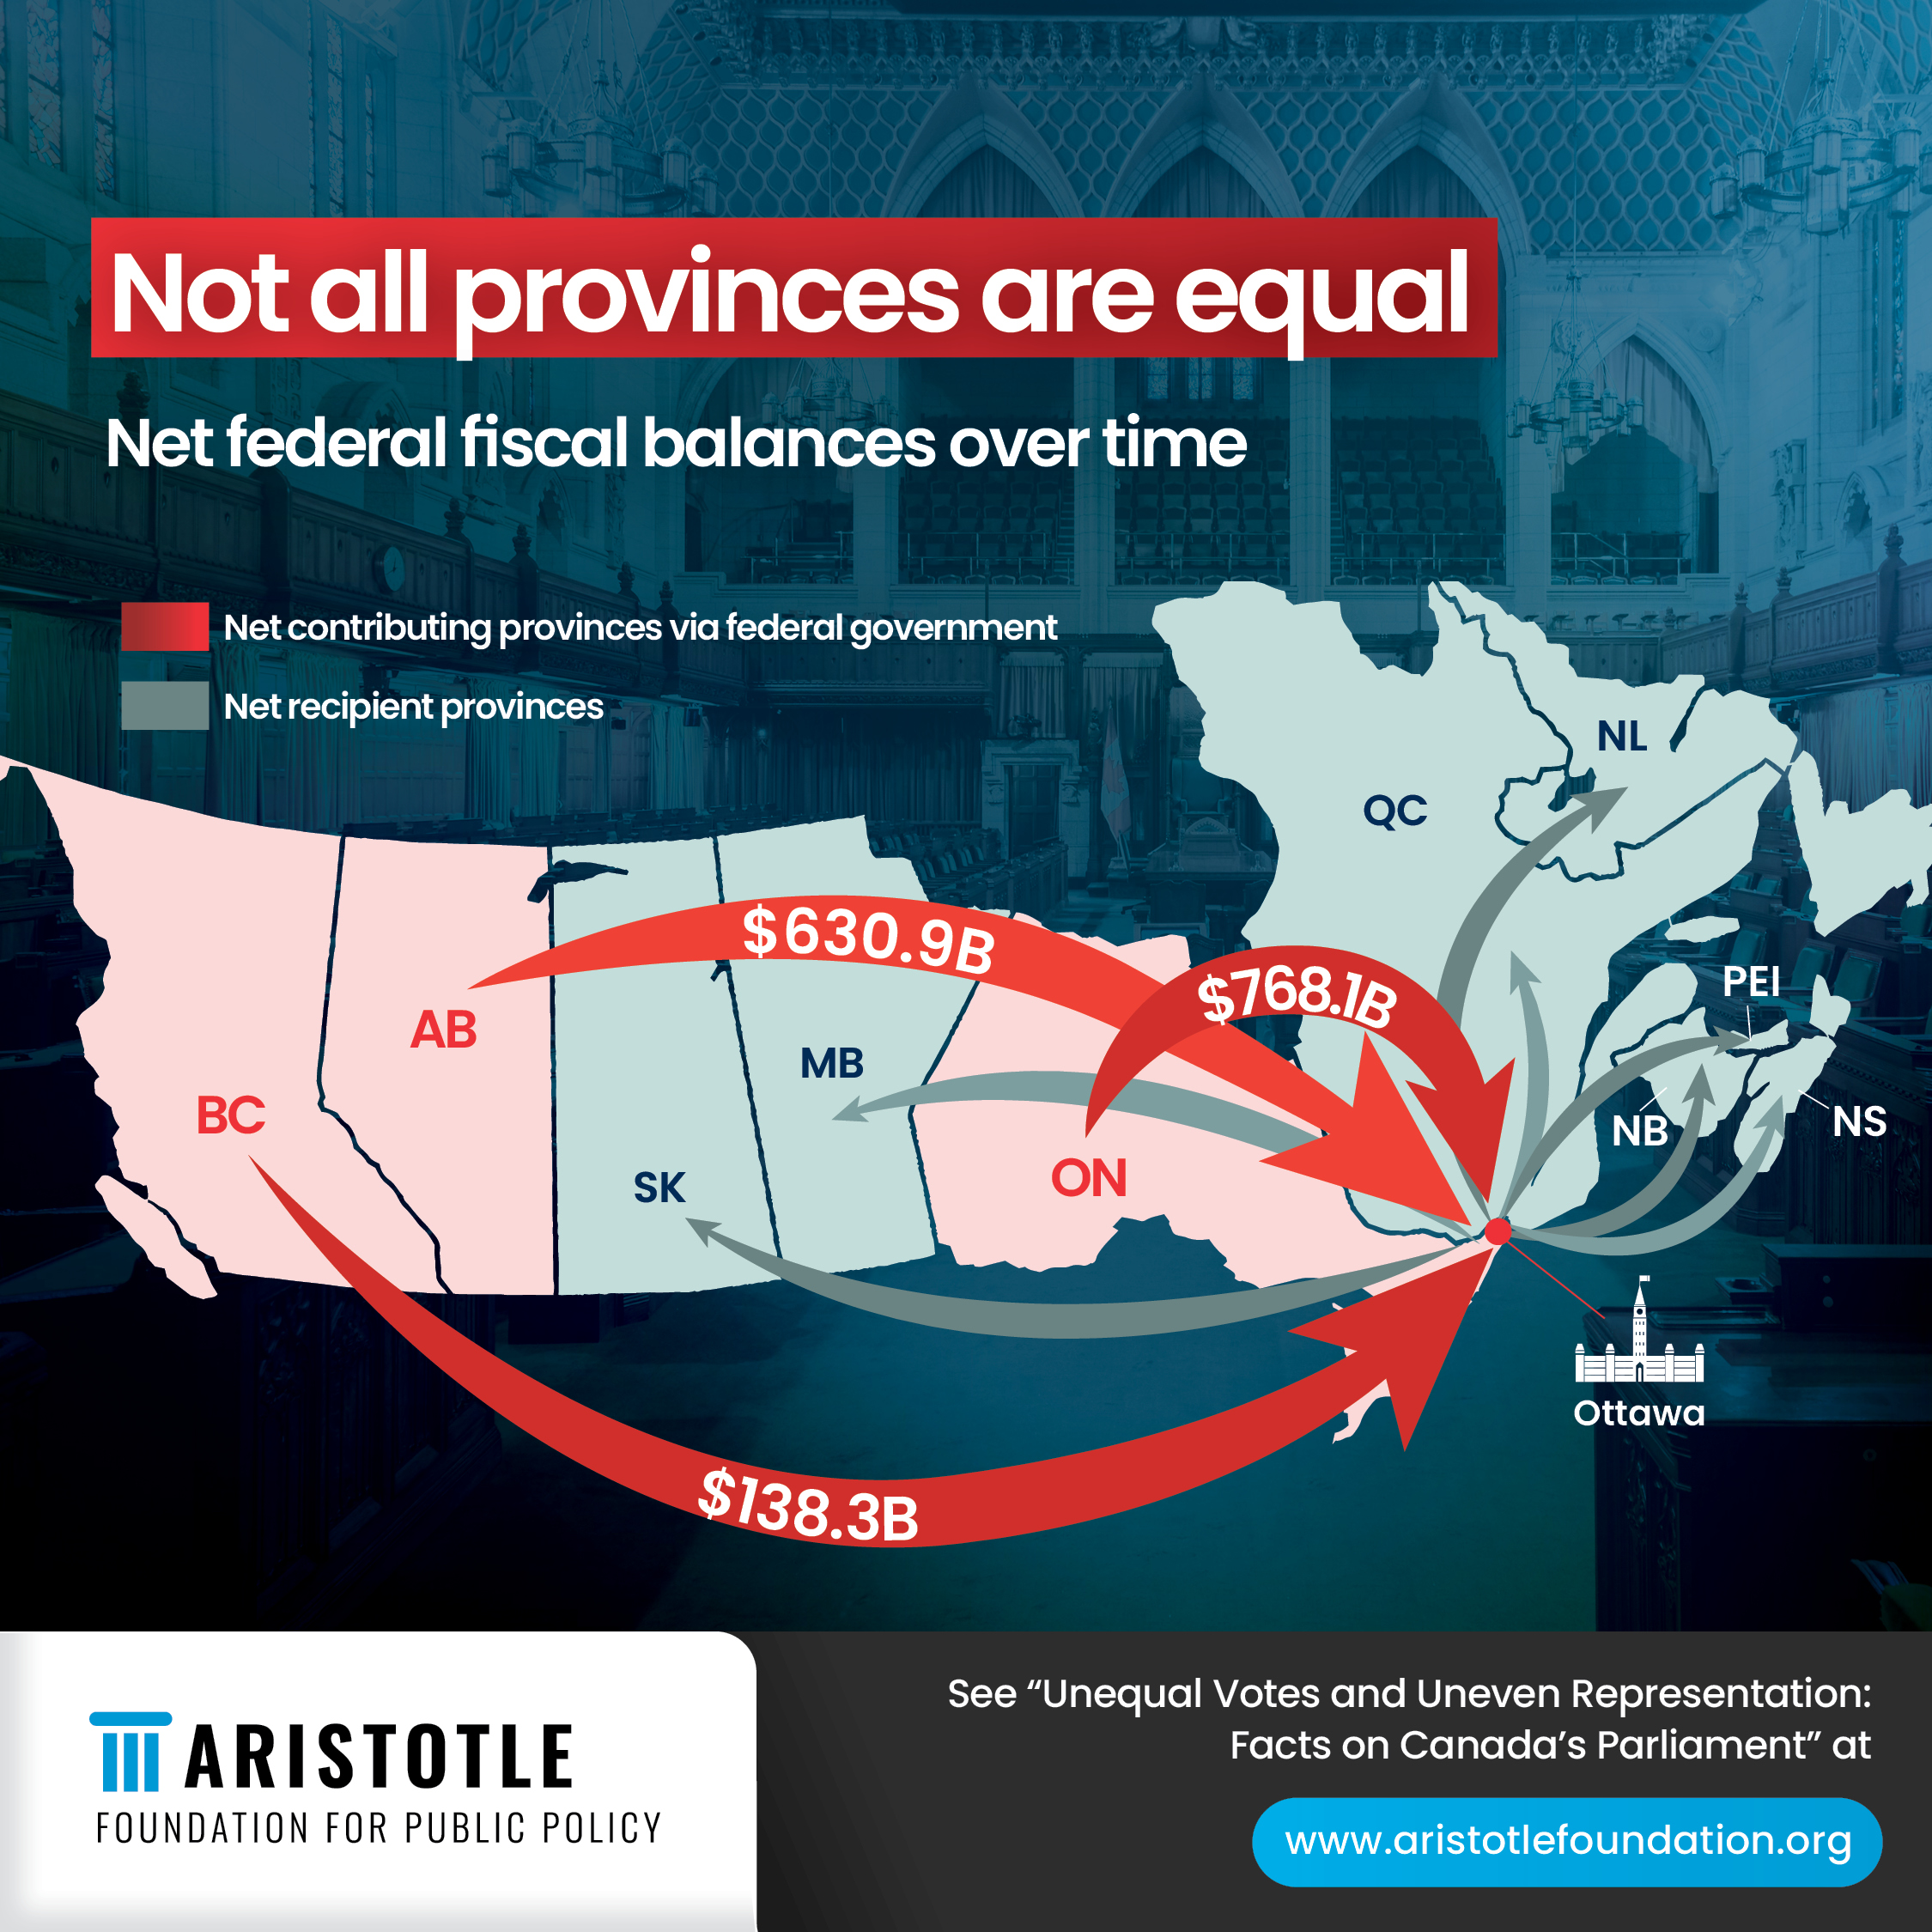
Question 14: Likeliness to support reform given Alberta’s net contributions
Question 14 asked if Canadians were more likely to support reforming federal transfers when they learned that Alberta “sent”—via the federal government—over $600 billion on a net basis to other provinces since the 1960s.
Knowing that about Alberta, 40% were somewhat or a lot more likely to support reforming federal transfer payments, with 46% responding it did not make them more likely to support reforming federal transfer payments. (Note that the 40% and 46% may, in question 13, have already previously supported reforming federal transfers or opposed reform but were persuaded by knowledge about Alberta in question 14.)
Data from the University of Calgary School of Public Policy, published in 2020, show that:
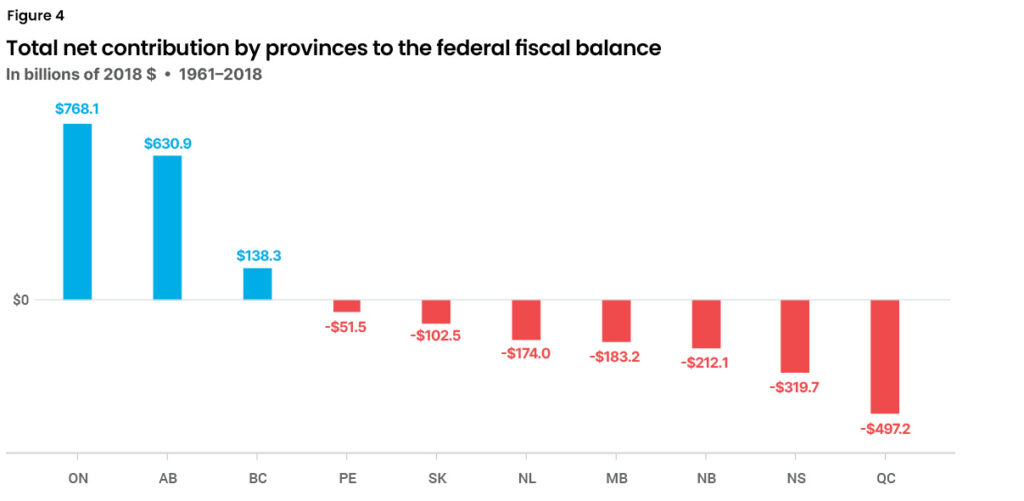
Source: R. Mansell, M. Khanal, & T. Tombe (2020), “The regional distribution of federal fiscal balances: who pays, who gets and why it matters,” The School of Public Policy Publications, 13 (June) <https://www.policyschool.ca/wp-content/uploads/2020/06/Federal-Fiscal-Balance-Mansell-Khanal-Tombe.pdf>.
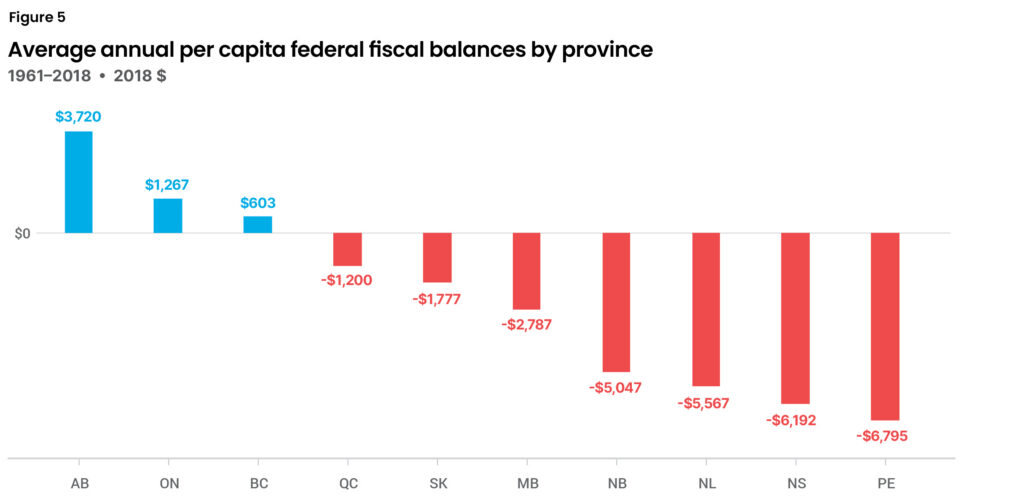
Source: R. Mansell, M. Khanal, & T. Tombe (2020), “The regional distribution of federal fiscal balances: who pays, who gets and why it matters,” The School of Public Policy Publications, 13 (June) <https://www.policyschool.ca/wp-content/uploads/2020/06/Federal-Fiscal-Balance-Mansell-Khanal-Tombe.pdf>.
Question 4: Provincial “weight” in Canada since 1949
Question 4 asked respondents if their province’s share of Canada’s population has grown since 1949, when the last province to join Confederation, Newfoundland and Labrador, became part of Canada. The question here was designed to tease out if a respondent knew if their province was a “bigger” or “smaller” part of Canada’s population “pie.” The 1949-2025 comparison is illustrated in Figure 6.4
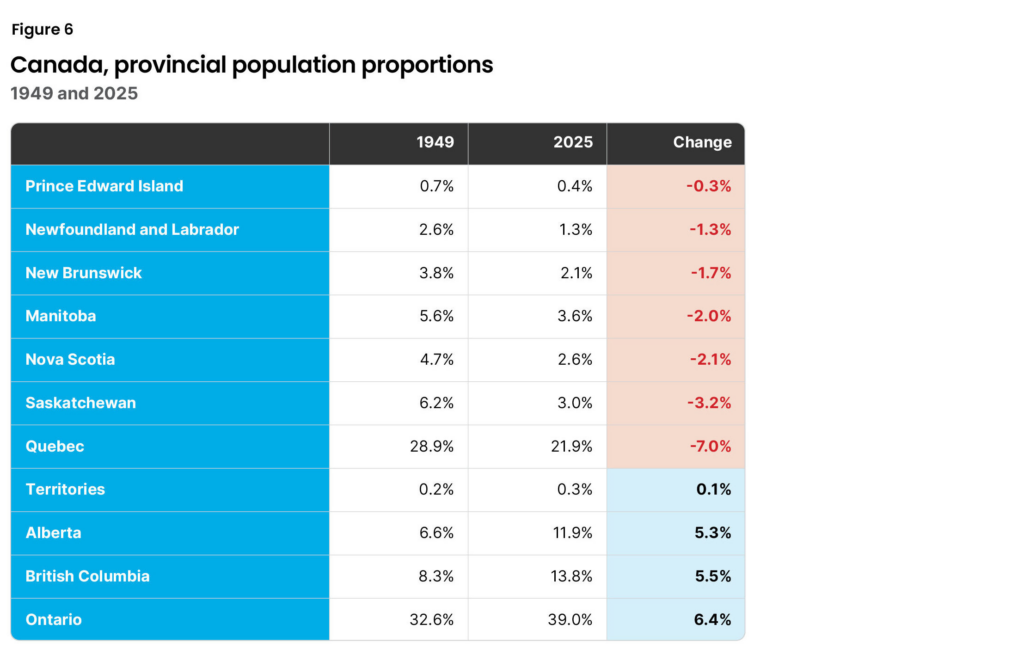
Source: Statistics Canada (2025), “Population estimates, quarterly—Table 17-10-0009-01,” Statistics Canada (December) <https://www150.statcan.gc.ca/t1/tbl1/en/tv.action?pid=1710000901> and Statistics Canada (2000), “Table 36-10-0280-01—Population of Canada and the provinces, annual, 1926 – 1960 (x 1,000),” Statistics Canada <https://www150.statcan.gc.ca/t1/tbl1/en/tv.action?pid=3610028001>.
Questions 5 and 6: Willingness to negotiate amid separatist threats
Questions 5 and 6 asked if Canadians were willing to negotiate on at least some demands if Western or Quebec separatism becomes a threat, with 55% willing to negotiate in the case of the West and 49% in the case of Quebec. Of note, 26% said “no” to negotiations vis-à-vis Western separatist demands, with 33% saying “no” if Quebec separation was an issue.
Questions 7 and 8: Support for House of Commons and Senate reform amid separatist threats
Questions 7 and 8 asked if Canadians favoured reform of the House of Commons and Senate in the case of threats from Western separatism and Quebec separatism.
Mark Milke, PhD, is the founder and president of the Aristotle Foundation for Public Policy. Mark is a public policy analyst and author with six books, over 70 studies, and more than 1,000 columns published in the last 25 years. He is the editor of the Aristotle Foundation’s first book, The 1867 Project: Why Canada Should Be Cherished–Not Cancelled. Mark is also the past-president of the Sir Winston Churchill Society of Calgary where he drove ahead the commissioning, fundraising, and installation of a statue of Churchill in Calgary on June 6, 2024—the 80th anniversary of D-Day.
Ven Venkatachalam, PhD, is a senior economist at the Aristotle Foundation for Public Policy. With expertise in economic and fiscal policy, international relations, trade, energy, governance, immigration, education, tourism, and NGO matters, Venkatachalam has consulted for governments, NGOs, and private sector organizations across Asia, Europe, Canada, and the United States.
Who we are
The Aristotle Foundation for Public Policy is a new education and public policy think tank that aims to renew a civil, common-sense approach to public discourse and public policy in Canada.
Our vision
A Canada where the sacrifices and successes of past generations are cherished and built upon; where citizens value each other for their character and merit; and where open inquiry and free expression are prized as the best path to a flourishing future for all.
Our mission
We champion reason, democracy, and civilization so that all can participate in a free, flourishing Canada.
Our theory of change: Canada’s idea culture is critical
Ideas—what people believe—come first in any change for ill or good. We will challenge ideas and policies where in error and buttress ideas anchored in reality and excellence.
Donations
The Aristotle Foundation for Public Policy is a registered Canadian charity, and all donations will receive a tax receipt. To maintain our independence, we do not seek nor will we accept government funding. Donations can be made at www.aristotlefoundation.org.
The Aristotle Foundation for Public Policy has internal policies to ensure research is empirical, scholarly, ethical, rigorous, honest, and contributes to the advancement of knowledge and the creation, application, and refinement of knowledge about public policy. Our staff, research fellows, and scholars develop their research in collaboration with the Aristotle Foundation’s staff and research director. Fact sheets, studies, and indices are all peer-reviewed. Subject to critical peer review, authors are responsible for their work and conclusions. The conclusions and views of scholars do not necessarily reflect those of the Board of Directors, donors, or staff.
Image credits: iStock